 |
| About Bioline | All Journals | Testimonials | Membership | News |
|
||||||
|
||||||
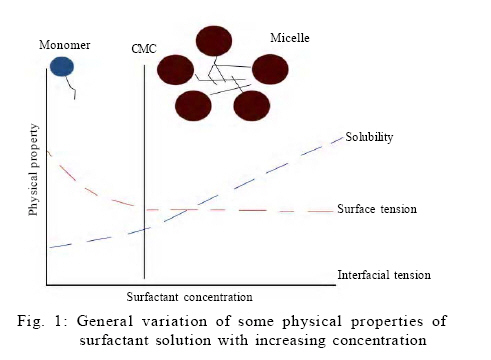
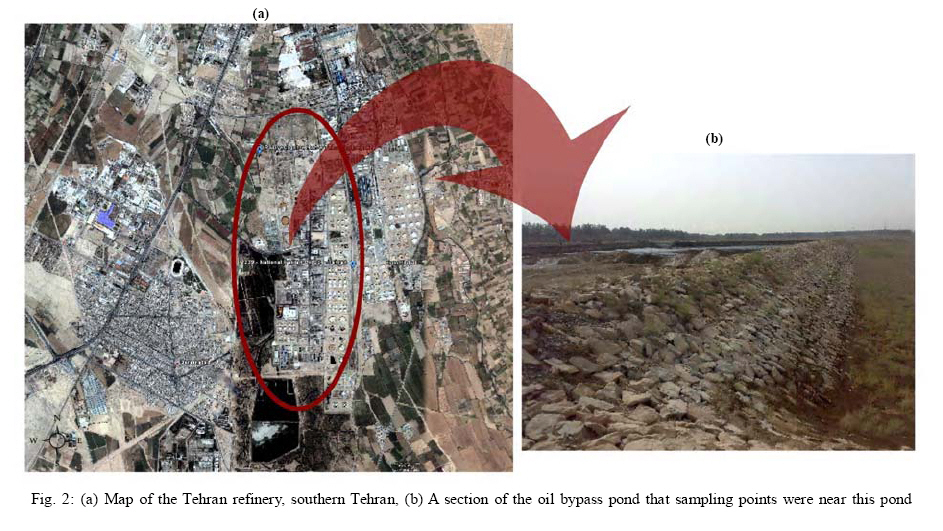
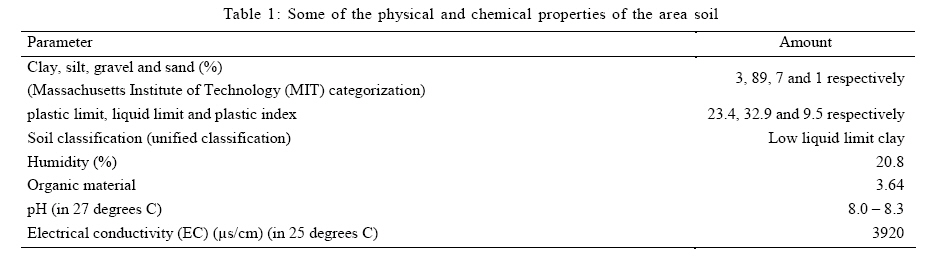
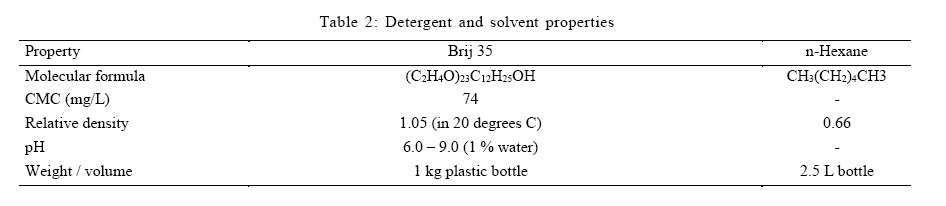
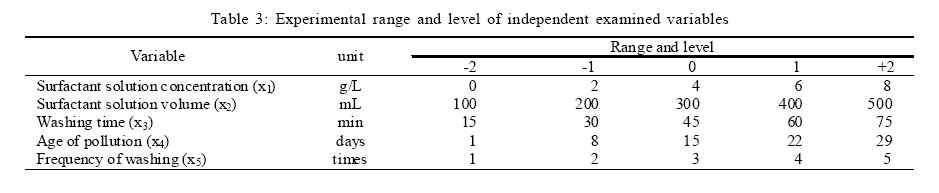
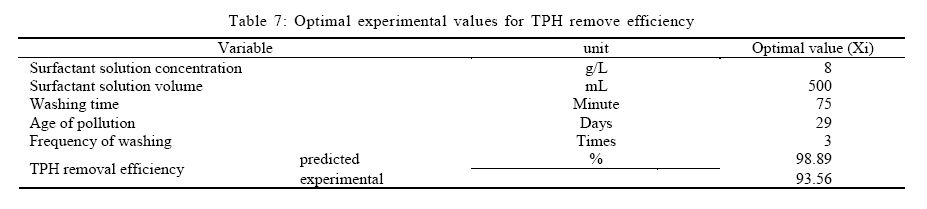
International Journal of Environment Science and Technology, Vol. 8, No. 2, 2011, pp. 389-400 Response surface methodology approach to the optimization of oil hydrocarbon polluted soil remediation using enhanced soil washing 1 *A. Kalali; 1T. Ebadi; 2A. Rabbani; 1S. Sadri Moghaddam 1Department of Civil and Environmental Engineering, Amirkabir University of Technology, Tehran, Iran *Corresponding Author Email: ardeshirkalali9@gmail.com Tel.: +98 511 8935139; Fax: +98 511 8935142 Received 3 May 2010; revised 20 October 2010; accepted 15 January 2011 Code Number: st11036 ABSTRACT: One of the environmental concerns in recent decades is the prevalence of different pollutants in soil. Hence, the importance of remediation has led to the development of various methods to remediate polluted soil. Among these methods, soil washing has gained significant attention to treat polluted soils. In this paper, the response surface methodology was applied in order to determine the optimal conditions for total petroleum hydrocarbon remediation using nonionic surfactant Brij35 in soil environment. The effect of different factors in soil washing process including surfactant solution concentration and volume, washing time, age of pollution and frequency of washing are evaluated. The predicted values for total petroleum hydrocarbon remediation efficiency by the response functions are in a very close agreement with experimental data (R2 = 98.75 %). The second order model was developed as experimented response and optimal conditions were obtained by analyzing the contour and surface plots and also by solving the regression equation using LINGO 9.0 software. The optimal concentrations (8 g/L), volume of surfactant solution (500 mL), washing time (75 min), age of pollution (29 days) and frequency of washing (three times) are determined. In this optimal condition, the removal efficiency has been observed to be 93.54 % which conforms to the results of process optimization using response surface methodology. Based on the results, it can be concluded that the response surface methodology is a suitable approach to determine the optimal conditions of soil washing to remediate organic hydrophobic pollutants using the nonionic surfactant Brij35 from the soil. Keywords: Experimental designs; Mathematical model; Soil remediation; Surfactant; Total petroleum hydrocarbon INTRODUCTION Soil washing, is one of the most primitive ways of remediation of soil out of pollutants. Today, in order to raise the remediation efficiency through lowering the pollutant exit time, some additive materials are used (Mulligan et al., 2001). According to the standards of US environmental protection agency, soil is applied to get the soil clear of organic, inorganic and radioactive pollutants (US EPA, 1998). Therefore, due to the existing limitations in mass transfer associated with highly absorbent oil compounds and also residual saturates, the enhanced soil washing approach using surfactant was developed (Chu and So, 2000; Abdulsalam et al., 2011; Nagheeby and Kolahdoozan, 2010). However, after using surfactant solution it causes some other types of pollutions. Hydrocarbon's pollutants are more hazardous than surfactant's and also there are various surfactants recovery and reusing technologies for emergency response (Chien and Shih, 2007). Considering soil washing is not a stand-alone process. After this process, analysis of the washed soil and each of the various waste streams (washed water, fine sediment, etc.) for the identification of contaminants should be done. Some of the technologies for recovering and reusing surfactants from original environments include ultrafiltration (Mulligan et al., 2001), pervaporation (Lipe et al., 1996), precipitation (Vanjara et al., 1996), foam fractionation (Darton et al., 2004), solvent extraction (Lee et al., 2002) and photochemical treatment (Chu et al., 2005). However, some of these methods are limited due to high-energy requirements, incomplete separation or the formation of potentially hazardous intermediates (Goyal et al., 2008). There are three interaction mechanisms between pollutants and soil: Sorption, complexation and precipitation. The general term of sorption (physical, chemical and special surface absorption) is used to describe processes in which the solved material (ions, molecules and elements) are divided between the common boundary of liquids and soil particles. The interaction via complexation and precipitation is created by organic pollutants. Due to the hydrophobic forces on the soil surface, organic pollutants are absorbed physically (Paria, 2008; Bandyopadhyay and Chattopadhyay, 2007; Harikumar et al., 2009). Organic pollutants, like oil hydrocarbons, colorized pesticides etc., having limited solubility in water, are usually absorbed into soil organic material and clay particles. In principal, the absorption level is a function of the material solubility in water and the amount of organic material present in the soil. The steam pressure of the solved material and the amount of clay in the soil has trivial roles in this regard. The absorption potential of a particular compound into a soil sample is demonstrated by the absorption linear isotherm slope (Stumm, 1992). The term "surface active agent" is used for a non-homogenous and long-chained molecule consisting of two hydrophilic and hydrophobic parts (Rosen, 2004). Their structure is composed of both polar (ionized) and non-polar (generally the 8 or 18 carbon-atom hydrocarbons) groups (Chu, 2003). In an aqueous environment, when the surfactant solution concentration exceeds a certain amount, the monomer molecules create a regular colony of molecules, called micelles. This special concentration level is called critical micelle concentration (CMC) (Paria, 2008). This point also corresponds to when the detergent has the least surface adsorption (Mulligan et al., 2001). Physical properties, like surface tension, inter-surface tension, adsorption and detergency, change in concentration levels below CMC and there is no change in these properties beyond CMC (Fig. 1). The surfactant solutions, however, cause significant changes in other physical properties such as density, organic solubilization and equivalent conductivities in lower and higher concentration than CMC. The saline level, hydrocarbon chain length and the type of detergent influence CMC (Mulligan et al., 2001; Paria, 2008). The life cycle of an individual surfactant molecule in room temperature is estimated at 1 to 100 microseconds (Whiten et al., 1982; Chu, 2003). Therefore, the micelles in surfactant can significantly increase the solubility of hydrophobic organic material and help remedy soil and precipitations from pollutants, especially for anionic and nonionic surfactant (Edwards et al,. 1991). The study of these processes is carried out in classical ways which is expensive and time-consuming and also, due to not considering the interaction effects of different parameters, cannot determine the practical optimal conditions. Under these situations, the use of statistical data as an optimization tool is an effective approach. One of these methods is the design of experiment (DOE) approach. The sample of this work was also performed by Rene in 2007 that experiments were conducted according to the 2k/1 fractional factorial design to identify the main and interaction effects of parameters and their influence on biodegradation of individual ethyl benzene and xylene compounds in mixtures (Rene et al., 2007). The response surface methodology (RSM) is a combination of mathematical and statistical approaches used for modeling different phenomena and optimizing the experimental results as a function of various parameters. In this paper, removal efficiency of TPH in soil washing with applying RSM has been investigated. Although due to the effect of different factors in this process, several variables are tested simultaneously with a minimum number of trials according to special experimental designs based on factorial designs. After that the second order model was developed as experimented response and optimal conditions were obtained by analyzing the contour and surface plots and also by solving the regression equation. All of these experiments were conducted in Civil and Environmental laboratory of AmirKabir University of Tehran between 6-18-2008 to 1-22-2010. MATERIALS AND METHODS Soil 5 kg soil was gathered from 4 point near one of the oil bypass ponds in Tehran refinery, located in Rey, southern Tehran (Fig. 2). Avoiding existence of surface soil and vegetation, soil samples were shoveled out from the depth of 10 to 30 cm. Also due to much silt in particle's size distribution of soil samples (Table 1), penetration of pollution in the layers of soil is moderated. In order to reduce light effect on samples properties, they were poured and sealed in thick black plastic bags until they are transferred to laboratory. After moving the samples to the laboratory (approximately last one hour), humidity determination tests were done. The samples were then dried for 3 days in room temperature. Some of their chemical and physical properties were examined afterwards. In order to avoid inconsistency and any other problems at the soil-washing stage, the soil particles were passed through American standard no.10 sieve (equivalent to 2.0 mm) to make them consistent and remove rocks, remaining plants and other large parts. This is because the particles bigger than 2 mm are not suitable for pre- refinement and are ineffective in soil-washing process (Noyes, 1994). In order to determine the particle's size distribution, the granulation test was performed separately, according to American Society for Testing and Materials (ASTM) D422-63, on large and small granules of the soil before passing them through no.10 sieve (ASTM, 2007). Due to the great significance of liquid and plastic limit in soil grading, the two parameters were chosen according to Std ASTM D4318-10 (ASTM, 2010). As a chemical property of soil, pH has a significant impact on remediation of polluted soil. In order to determine pH of the sample, SW846 method of Environmental Protection Agency (EPA) Std was used for non-lime soils (US EPA, 2000). Also for measuring electrical conductivity (EC), 5.0 g of each soil samples (in a sample cell) was added to 50 mL of distilled water. The lump of the soil was stirred to form homogenous slurry, then the conductivity meter probe (Condo 340i, WTW model) was immersed into the sample and allowed to be stabilized at 25 ºC and EC of sample was recorded (Osuji and Ezebuiro, 2006). Finally, the proposed approach by Jonsson et al. 2007 was applied to determine the percentage of organic material present in the soil (loss-on-ignition method). The average values for physical and chemical properties of the area soil obtained according to standards, are listed in Table 1. Surfactant, solvent and pollutant Nonionic surfactant Brij35 (white granules) was used in this research. The solvent was normal hexane, the properties of which are given in Table 2. Crude oil from Tehran refinery with a density of 0.871 g /cm was used as pollutant for this research. Contamination of samples For this purpose, 50 g of crude oil was solved in 80 gr of n-hexane (or 8 % (w/w)) and then mixed with one kg of the prepared soil. Usage of n-hexane was to solve crude oil in soil to achieve uniform contaminated soil. Amount of n-hexane depends on temperature, agitation, volume of beaker, etc. Since the solvent presence in the soil prevents the pollutant absorption into the soil, the mixing should be maintained until the whole solvent evaporates. So it can be stated that one kg of soil has been polluted with 50 g of crude oil uniformly which this amount of contamination equals 5 % (w/w) which is 50,000 ppm. Preparation of surfactant solution The following procedure was implemented to get a solution with desired concentration: certain amount of Brij35 (Table 3) was scaled and poured into a clean volumetric flask and distilled water was added to 1000 mL. For the surfactant to dissolve completely in water, the flask was shaken well. Since this action caused some foam to evolve in the water surface the mixture was rested a while until the foam disappeared. By this way, the surfactant solution can reach 0, 2, 4, 6, 8 g/L concentration. Soil washing To remedy through washing by surfactant solution, 50 g of polluted soil was precisely scaled and poured into beaker initially. Then, certain amount of the surfactant solution with known concentration was added to the soil and the soil washing process was started in room temperature using a Jar Test device from Zag-Chemi Co. (Iran) with a fixed speed of 250 rpm. After washing, the water solution containing surfactant and the omitted oil pollutant should be separated from the washed soil. Therefore, the sample was allowed to precipitate after being washed. The analysis of the soil oil compounds consisted of two overall stages: extraction (with Soxhlet extraction method) and pollutant measurement using gas chromatography device from Agilent technologies 6890N (England) with capillary column with 30 m*320 mm*0.25 mm nominal dimensions and FID detector. All the analysis stages were implemented according to manual of oceanographic observations and pollutant analyses methods (MOOPAM) standard (MOOPAM, 1999). Experiment design and data analysis RSM is one of the new methods which is divided into two categories, namely, Box-Behnken Design and central composite design (CCD). The latter approach was utilized here to assess the amount of oil compound removed. There are several effective factors in the soil washing approach for removal of contaminated soil from total petroleum hydrocarbon (TPH) which includes: surfactant solution concentration, type and granulation of the soil, the surfactant solution volume, the solution mixing speed at washing time, the type of surfactant (anion or nonionic), the solution temperature, mixture of different surfactants, the age of pollution and frequency of washing. In order to study the impact of these parameters on the ultimate efficiency and due to the high costs of the experiments, surfactant solution concentration (x1), surfactant solution volume (x2), washing time (x3), age of pollution (x4) and frequency of washing (x5) were evaluated based on previous experiences and some primary experiments. Considering the fact that some of these natural properties of soil for remediation were in appropriate range, the parameters were accepted. For example according to Jayashree and Vasudevan, 2007 appropriate range of soil pH for surfactant performance was 8 to 8.5 which can be observed in Table 1. Also the acidity range of pH may pose some constraints on the remediation or decontamination process of the affected site (Osuji et al., 2006). Moreover the addition of inorganic salts, which can be demonstrated from EC, can greatly reduce the surfactant solution concentration required and thereby makes the method more cost-effective (Han et al., 2009). The experimental range and level of the above variables are given in Table 3. An overall of 32 experiments were carried out considering the half fraction factorial of CCD consisting of 16 cube points, 10 axial points and 6 replicates at the center points. For the statistical calculations, the variables Xi (the actual value of independent variable) were coded as xi (dimension-less value of the independent variable) according to the following equation (Montgomery, 1996): xi = (Xi-X0)/δX Where X0 is the Xi value in the central point and äX represents the step change. The experimental data were analyzed using Minitab v15.1.1.0 software and were fitted into empirical second-order polynomial model in order to optimize the variables in the soil washing process. The second order equation to predict the optimal condition is expressed as (Montgomery, 1996):
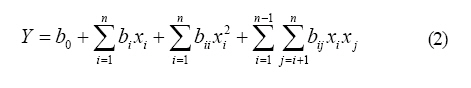
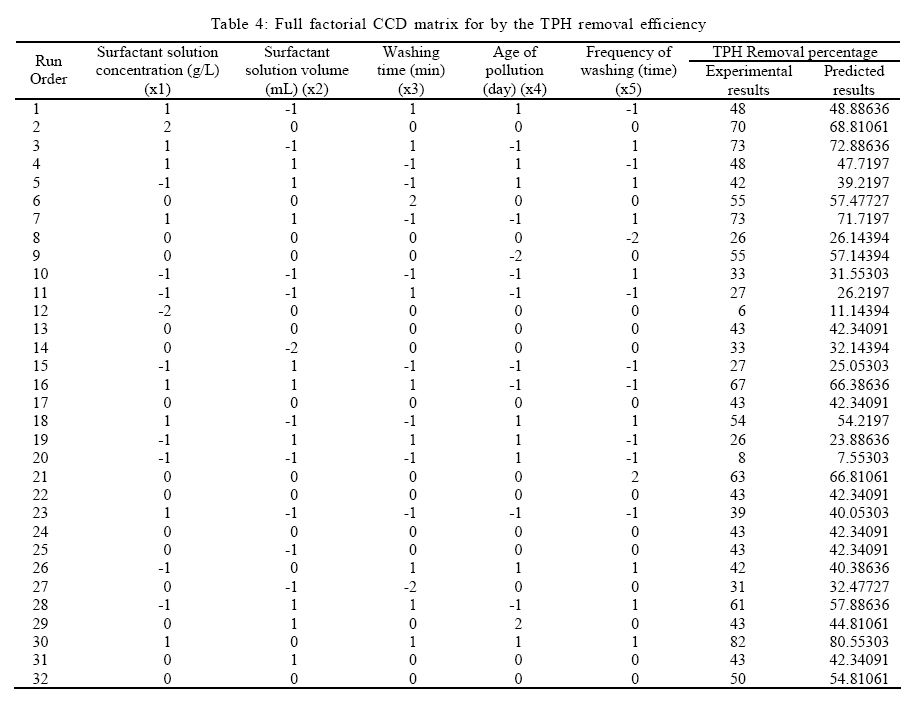
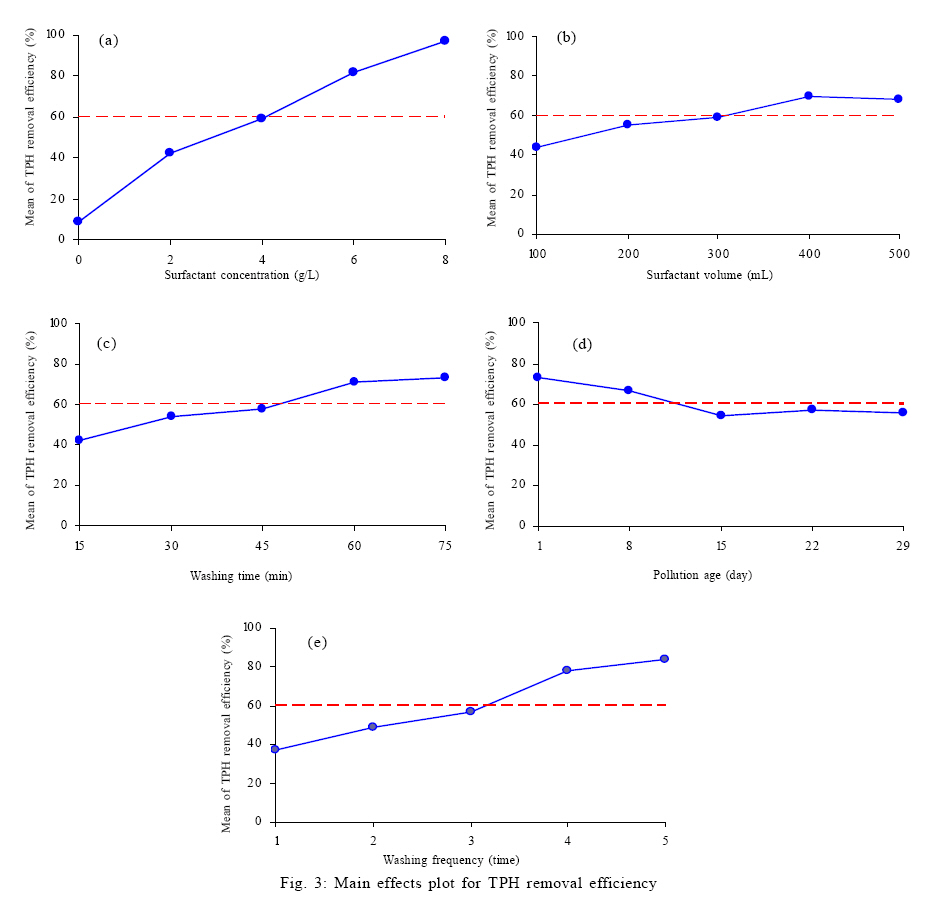
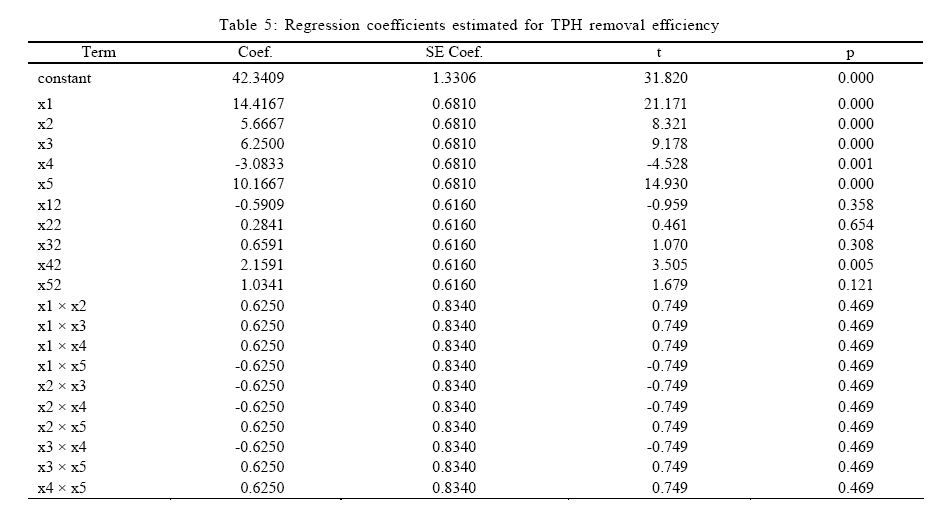
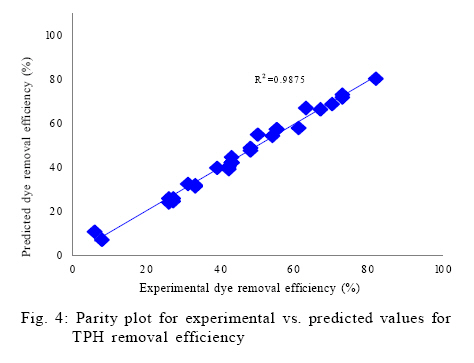
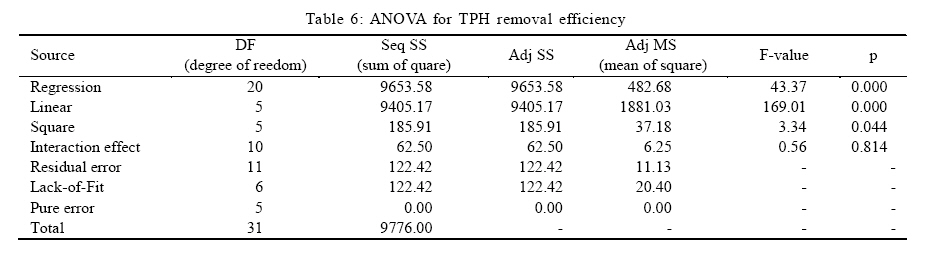
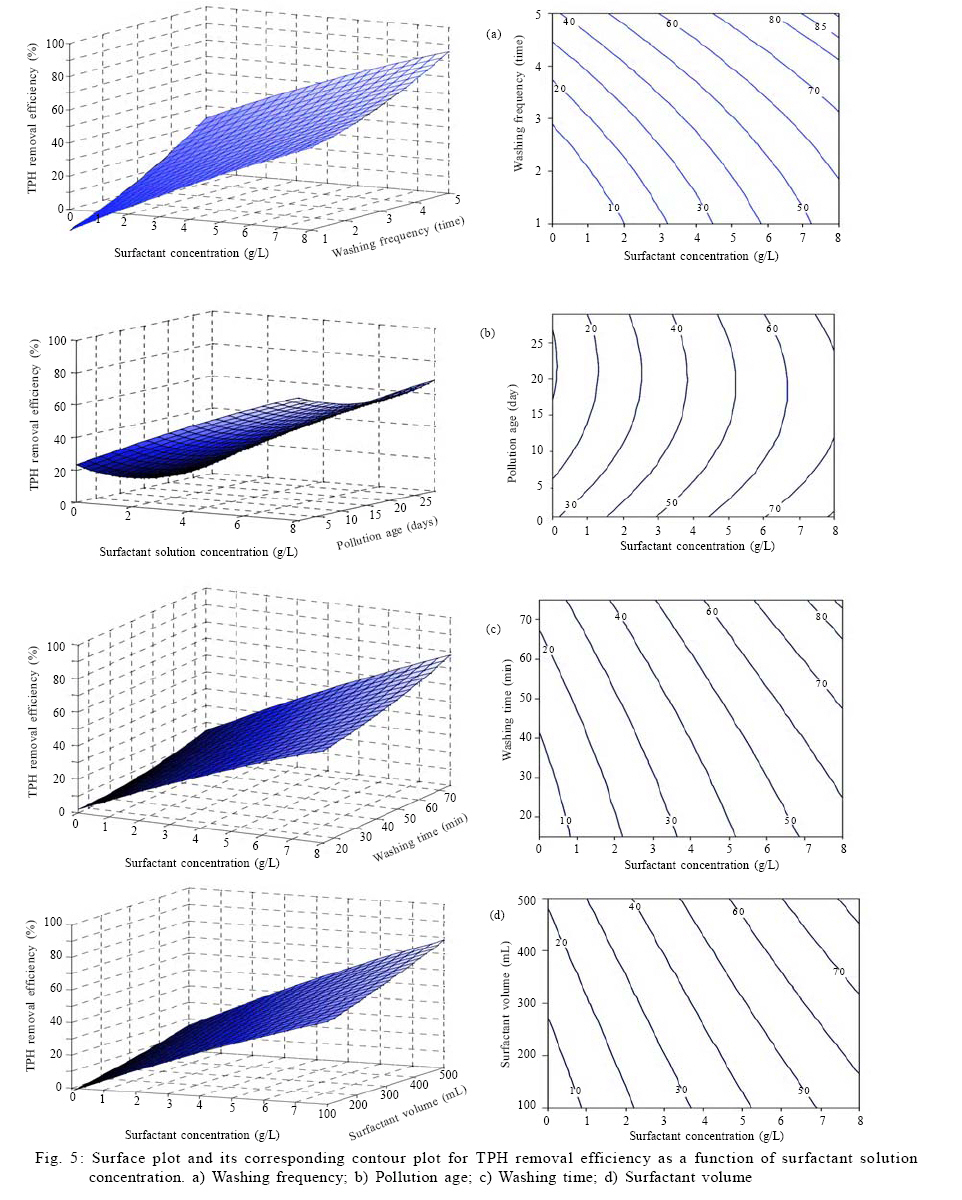
Where Y is the predicted response by the model (TPH removal efficiency), b0 is a constant, bi are linear coefficients, bii are second-order coefficients, bij are interaction coefficients and xi and xj are the coded values corresponding to the tested variables (Montgomery, 1996; Myers and Montgomery, 2002). Then the validity of the predicted model is verified by analysis of variance (ANOVA). The second-order model quality is assessed by the correlation factor (R2) and the result analysis is carried out using Fischer trial and probability value (with 95 % confidence level). Finally, the optimal values of tested variables are obtained by analyzing the surface curves and regression equation optimization, using Lingo 9.0 software. RESULTS AND DISCUSSION In order to study the interaction effects of the selected variables, the experiments were carried out by different combinations, designed according to CCD that is given in Table 4. The experiment design matrix along with the experimental values and also predicted values by the software for the percentage TPH removal efficiency, are given in Table 4. Main effects plot for TPH removal efficiency on soil washing is illustrated in Fig. 3. The results show that the surfactant solution concentration is one of the main influential parameters in process efficiency. Since only the distilled water was used for removing oil pollutants, the removal efficiency obtained was nearly 11 percent which, to some extent, was in agreement with results obtained by Urum et al. 2004 who had reported the efficiency of crude oil removal from soil using distilled water to be between 10 to 50 percent (depending on different situations) (Urum et al., 2004). As it can be observed (Fig. 3a), when the surfactant solution concentration is increasing, the system efficiency rises yielding the maximum jump between 0 to 2 which is the result of concentration increase beyond the critical value of Brij35 micelles (74 mg/L). As can be seen in Fig. 3b, c and e, by increasing the surfactant solution volume, time and frequency of washing, the TPH removal efficiency will increase. The maximum removal efficiency is observed in a volume of 400 mL, washing time of 75 min and 5 times washing by surfactant solution. In researches carried out by Jafvert (1996) using Tx-100 surfactant to remediate trichloroethylene (TCE), an increase of 30 % in removal efficiency was reported when using 500 mg/L of the surfactant, which verifies the results of this paper, given the type of soil and surfactant with lower CMC in the current research (Jafvert, 1996). Moreover, Han et al. 2009 with investigating the effect of time (from 5 to 60 min) in crude oil contaminated removal efficiency came to the conclusion that although increasing the time of soil washing will enhance remediation, but the optimal situation can be reached in 30 min which the similar result in accordance to the process of removal is showed in Fig. 3c (Han et al., 2009). The age of pollution, unlike other parameters, had a negative effect on system efficiency (Fig. 3d) in a way that, by increase of pollution age, the rate of TPH removal efficienc decreased. This was probably due to formation of more powerful bonds between pollutants and the soil particles as the age increased. The response function coefficients, value of t and p for system efficiency were obtained by laboratory data given in Table 5. It was observed that the probability coefficients (p-value) for surfactant solution concentration (x1), its volume (x2), washing time (x3), age of pollution (x4), frequency of washing (x5) and the square term of age of pollution (x42) were less than 0.05, given a certainty level of 95 %. Hence, these parameters have significant impact on the system efficiency, whereas the square terms, except for the age of pollution and interaction effects between variables, would not have notable effect on the system response (TPH removal efficiency). Using the experimental results and data analysis, the regression model equation was obtained as Eq. 3. Apart from the linear effect of the parameter for the TPH removal, the RSM also gives an insight into the quadratic and interaction effect of the parameters. The system response (Y) is predicted by Eq. 3 and is given in Table 4. Y = 42.3409+ 14.4167 x1 + 5.6667 x2 + 6.2500 x3 - 3.0833 x4 + 10.1667 x5 -0.5909 x12+0.2841x2 2+0.6591 x32 + 2.1591 x42 + 1.0341x52 + 0.6250 x1 × x2 + 0.6250 x1 × x3 + 0.6250 x1 × x4 -0.6250 x1 × x5 -0.6250 x2 × x3 -0.6250 x2 × x4 +0.6250 x2 × x5 -0.6250 x3 × x4 +0.6250 x3 × x5 + 0.6250 x4 × x5 (3) To examine the validity of predicted model by computer software, the graph representing experimental values for TPH removal efficiency against the predicted model was prepared (Fig.4). The high correlation, close to unity, is more than desired and verifies the second-order model satisfactory conformance to the experimental data. In this research, the value of R2=98.75 % verified the accuracy of the model. The validity of the model was further evaluated by ANOVA. TPH removal efficiencies given by ANOVA are presented in Table 6. In the current research, the probability for regression equation (Eq. 3) is 0 (P<0.05), which certifies that the binomial model is conforming with the experimental results with great reliability (Khuri and Cornell, 1987). One of the main parameters affecting TPH removal efficiency is the surfactant solution concentration. The 3D plot and its corresponding contour plots for surfactant solution concentration (as the dominant parameter with an index of 14.41 in mathematical equation of PH removal) versus other variables and its effect on the removal efficiency is illustrated in Fig. 5. In this figure, the constant values for parameters are 3 times, 15 days, 45 min and 300 mg/L for frequency of washing, age of pollution, washing time and surfactant volume, respectively. As is evident, increasing of surfactant solution concentration up to 3 g/L and repeating the washing action three times, will cause an increase of about 20 % in the removal efficiency. The increase will be around 40 % if the concentration rises to 6 g/L and washing is performed 5 times. Finally, the removal efficiency will exceed 80 % if the concentration and frequency of washing are increased to 8 g/L and 5 times, respectively. The interesting fact is the little impact of washing frequency on the efficiency compared to that of surfactant solution concentration. For instance, in a concentration of 4 g/L, by increasing of the washing frequency from 1 to 5, the removal efficiency will increase from 30 to 60 percent. Assuming 3 iterations, however, the efficiency rises from 10 to 70 percent by increasing concentration from 1 to 8 g/L (Fig. 5a). Increase in surfactant solution concentration is significantly more influential than the age of pollution. For example, taking concentration as 4 g/L, the removal efficiency will only change slightly by increasing of the pollution age, whereas it will rise considerably from 10 to more than 80 percent when the age of pollution is taken 20 days and surfactant solution concentration is increased up to 8 g/L. The age of pollution may be important factor in long-term as the long time of pollution will increase the pollutant adherence of the soil particles and thus would lower the removal efficiency (Fig. 5b). On the other hand, the system efficiency will increase by simultaneous increase in surfactant solution concentration and washing time (Fig. 5c). This is also the case when surfactant solution concentration and its volume are increased (Fig. 5d). It is evident in all graphs that surfactant solution concentration is the dominant influencing factor in removal efficiency compared to other parameters.One of the main purposes of this research is getting the optimal conditions for TPH removal from oil-polluted soil using soil-washing approach. For this purpose, in order to maximize TPH removal efficiency, the regression equation (Eq. 3) has been optimized by Lingo software. The optimal values of variables have been calculated in coded units and converted to real (coded) values. The soil washing process results are given in Table 7. The Result has compatibility with Ahn research in 2008 who has investigated the effect of the four surfactants solution. Brij35 with 0.5 to 5 g/L concentration was used for soil washing in soil contaminated with concentration of 0.2 g/kg (or 0.02 % (w/w)) has reached 71.6 ± 16.3 percentage of removal efficiency, in which maximum removal efficiency was 88 % in 5 g/L surfactant solution concentration (Ahn et al., 2008). CONCLUSION The selection of effective parameters in soil washing operation for contaminated soil remediation is of most importance. By choosing nonionic surfactant Brij35 with low CMC (74 mg/L) and utilizing experiment design approaches, a mathematical model was achieved that determines the effects of influential parameters on the soil-washing process. This includes: surfactant solution concentration, surfactant solution volume, washing time, age of pollution and also frequency of washing on the developed removal efficiency percentage. So the optimal conditions were reached using the surface graphs and Lingo software. According to the obtained results, optimal values for surfactant solution concentration, surfactant solution volume, washing time, age of pollution and frequency of washing were obtained, respectively, as 8 g/L, 500 mL, 75 min, 29 days and 3 times. The effect of surfactant solution concentration is 2.5 times that of surfactant solution volume, 2.3 times that of washing time, 4.7 times that of pollution age and 1.4 times that of frequency of washing. The first order of parameters has a direct and significant impact on the removing process, whereas the second order parameters, except for age of pollution, and their interaction effect, basically do not play an important role in system response, i.e. the TPH removal efficiency. The response surface methodology can be useful in determining the efficiency of oil-compound removal and its effective parameters. However, according to these research and Jayashree et al. 2006, optimal surfactant solution concentration, surfactant solution volume, washing time, age of pollution and frequency of washing for increasing the removal efficiency need to be investigated before remediation. This may depend on the nature of the contaminant and the soil type (Jayashree et al., 2006). Moreover the physico-chemical state of soil, such as organic matter and variation in pH might have also been responsible for poor or good recovery of contaminants of soil (Volkering et al., 1998). Also high hydrocarbon content of soil has been known to affect soil physico-chemical properties, which in turn affect the remediation potentials of soil (Ezebuiro, 2004). Finally, because of surfactant solution pollution, it is necessary to develop a surfactant recovery technology that is simple, economical and effective which depends on each condition of experiments. One of the simple and effective methods is activated carbon for surfactant recovery in soil washing solution by selective adsorption. Selective adsorption was potentially effective to reuse surfactant in soil washing process since the partitioning coefficients of hydrocarbons (especially PAHs) are much higher than nonionic surfactants (Ahn et al., 2008). In full scale remediation projects, surfactant's recovering and reusing technologies can be a part of the whole remediation system for reducing the expenses of surfactants. ACKNOWLEDGEMNETS The Authors would like to thank Ms. Maryam Akbari and Ms. lida Ezzedin for their cooperation in civil and environmental laboratory of Amirkabir University. Also wish to thank Ms. Reihane Peirow for her assistance during the analyses of samples. REFERENCES
© IRSEN, CEERS, IAU The following images related to this document are available:Photo images[st11036f3.jpg] [st11036t4.jpg] [st11036f1.jpg] [st11036f4.jpg] [st11036t7.jpg] [st11036t1.jpg] [st11036f5.jpg] [st11036t6.jpg] [st11036t5.jpg] [st11036t2.jpg] [st11036f2.jpg] [st11036t3.jpg] |
| |||||||||
