 |
| About Bioline | All Journals | Testimonials | Membership | News |
|
||||||
|
||||||
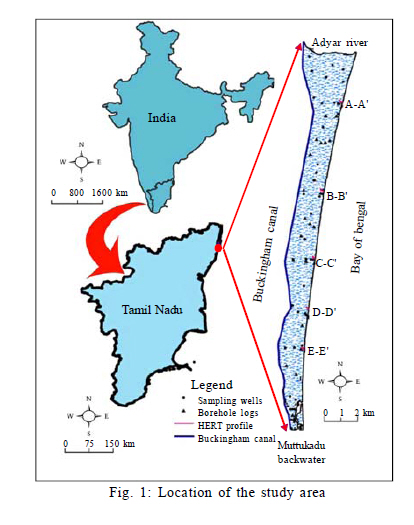
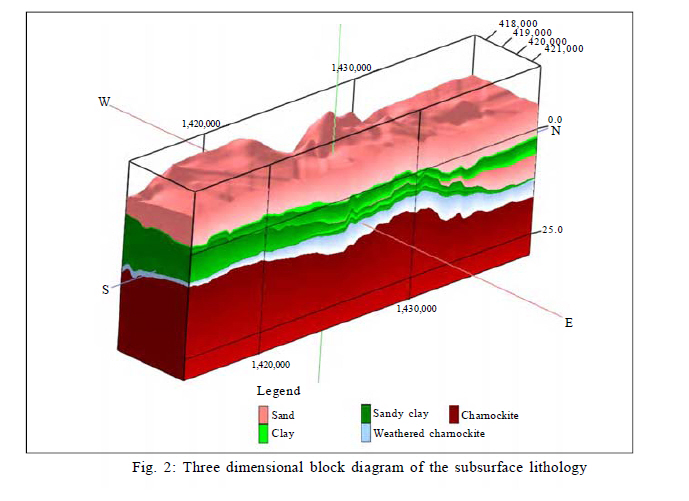
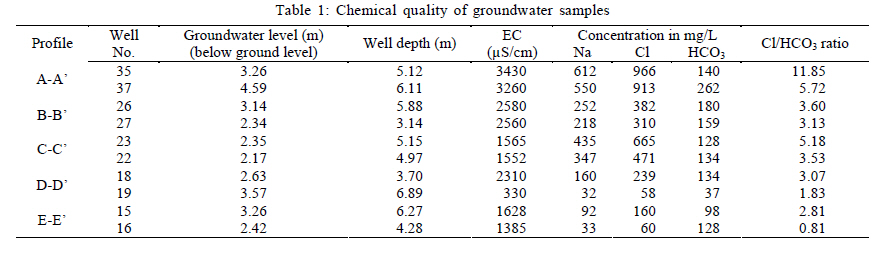
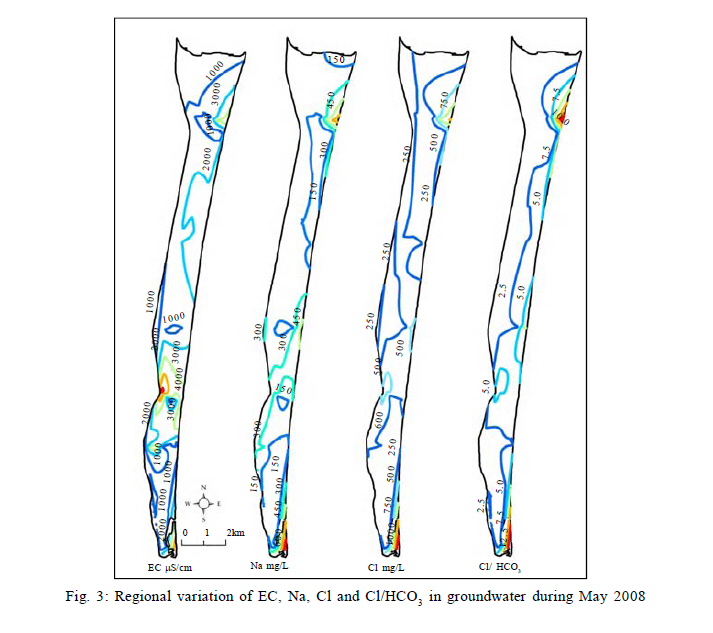
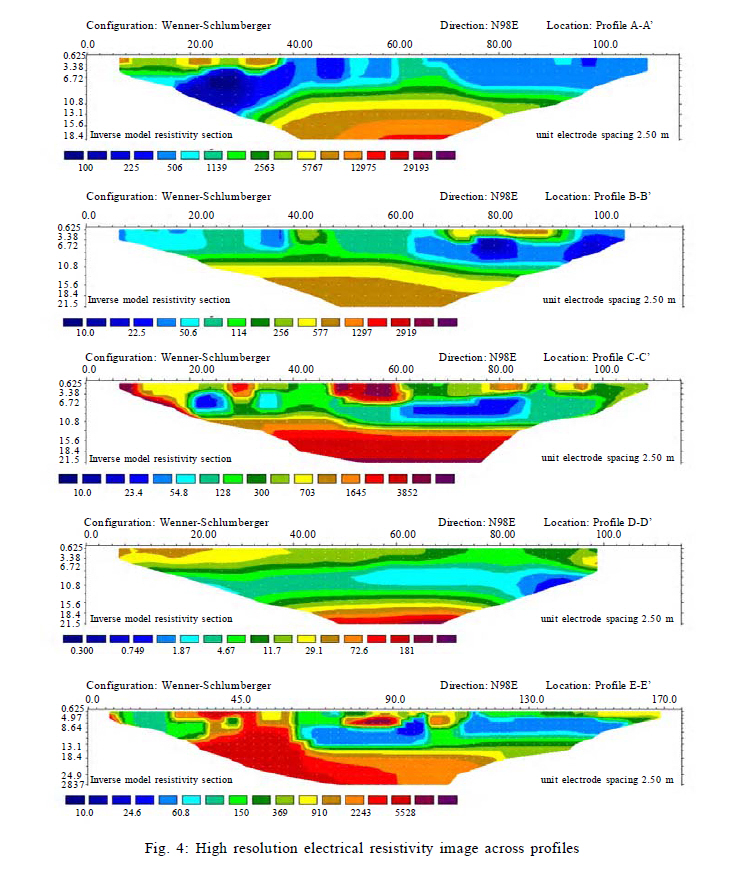
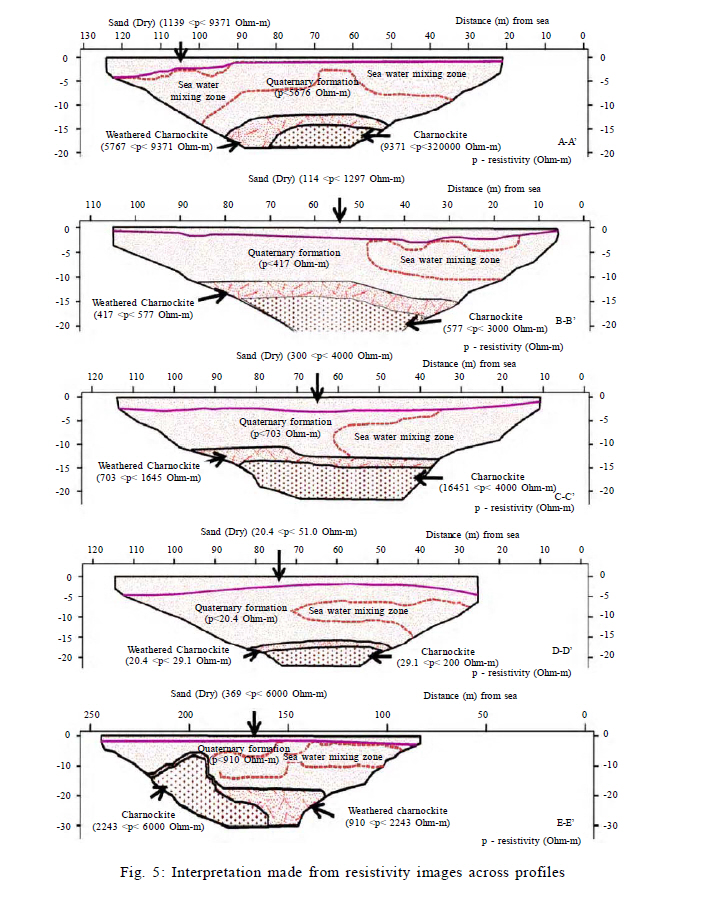
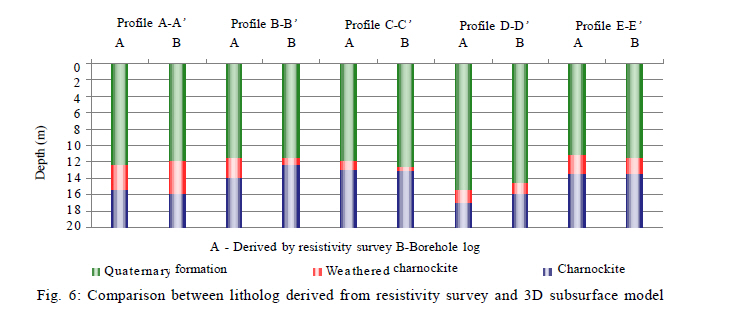
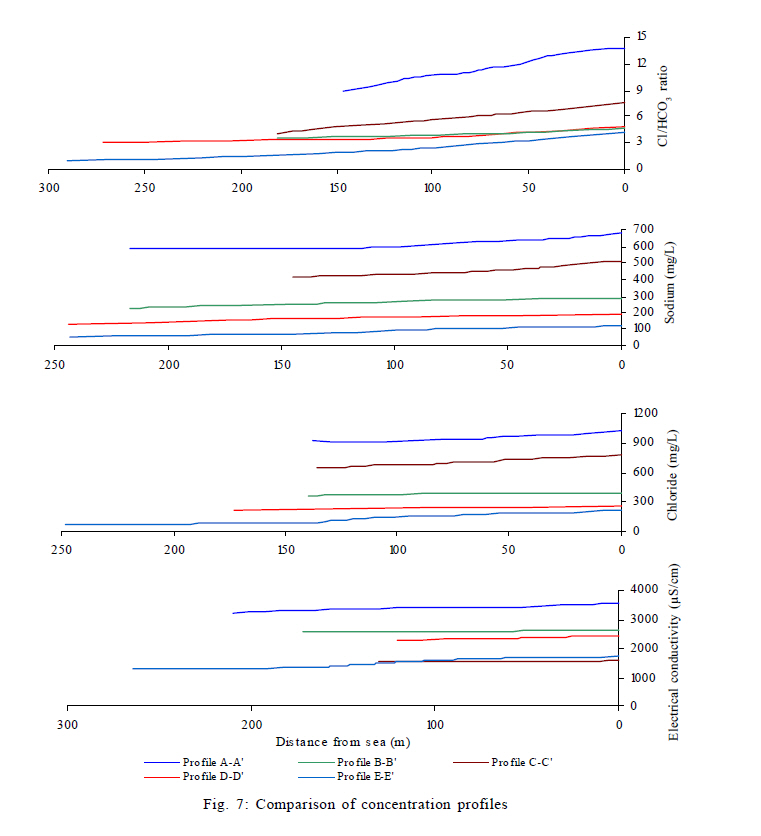
International Journal of Environment Science and Technology, Vol. 8, No. 3, 2011, pp. 483-492 Assessment of seawater mixing in a coastal aquifer by high resolution electrical resistivity tomography 1 S. Sathish; 1 *L. Elango; 2 R. Rajesh; 2 V. S. Sarma 1 Department of Geology, Anna University, Chennai, Tamil Nadu, India *Corresponding Author Email: elango@annauniv.edu Tel./ Fax: +9144 2235 8445 Received 31 July 2010; revised 8 February 2011; accepted 13 March 2011 Code Number: st11044 ABSTRACT: Seawater intrusion is a major problem in urbanized coastal regions of India which is due to over exploitation of groundwater for various purposes. This study was carried out with the objective of assessing the zone of mixing between seawater and groundwater in the coastal aquifer in south of Chennai, Tamil Nadu, India using high resolution electrical resistivity tomography. High resolution electrical resistivity tomography was carried out in five profiles perpendicular to the sea using IRIS make SYSCAL Pro-96 system with 2.5 m or 5 m inter-electrode separation. The maximum length of the profile was 170 m which resulted in a depth of investigation of 28.7 m. The apparent resistivity measured in this area varies from 0.3 ohm-m to 30,000 ohm-m. The apparent resistivity of saturated zone decreases towards the sea, indicating the influence of seawater. This was also confirmed by measuring the electrical conductivity of groundwater, which gradually increases from 156 µS/cm to 3430 µS/cm towards the sea. Further, the concentration profiles of electrical conductivity, sodium, chloride and chloride / bicarbonate ratio are compared with the high resolution electrical resistivity tomography profile. The distance of influence of seawater is comparatively high in northern part than in southern part of the area. The high resolution electrical resistivity tomography was effectively used to determine the effect of seawater mixing with groundwater. Keywords: Electrical conductivity; Groundwater quality; Lithology; Seawater intrusion INTRODUCTION The physical and chemical nature of groundwater can be assessed by analyses water and this procedure is widely used. However, this procedure required lot of efforts and cost. The quality of groundwater in coastal aquifers deteriorate as a result of the over pumping of water that was previously discharged in to the sea (Gallardo and Marui, 2007). This problem is common in coastal areas throughout the world and the same has been reported by many researchers (Apello et al., 1987; Gnanasundar and Elango, 1999; Bakker, 2000; Shammas and Jacks, 2007; Chenini and Khemiri, 2009; Praveena and Aris, 2010). The intrusion of seawater has been identified by many approaches such as isotope studies (Yechieli and Sivan, 2008), geochemical and geophysical studies (Melloul and Goldenberg, 1997; Gnanasundar and Elango, 1999; Ibrahim et al., 2003; Di Sipio et al., 2006; Aris et al., 2007; Cimino et al., 2008). The advantages of resistivity survey are: 1) Non-invasive technique and no requirement of water sampling; 2) Relatively inexpensive, can be used for rapid and economical monitoring of large areas; 3) Assist in the optimization of the required number of monitoring wells; and 4) Electrical conductivity / resistivity are intrinsic properties of groundwater chemistry that are readily interpreted in terms of the degree of groundwater contamination (Ebraheem et al., 1990; 1997). The resistivity technique has its origin in 1920 (Koefoed, 1979). The resistivity survey is widely used in the identification of seawater mixing along the coastal settings worldwide (Urish and Frohlich, 1990; Frohlich et al., 1994; Nowroozi et al., 1999; Gnanasundar and Elango, 1999; Choudhury et al.,2001; Nouri et al., 2008; Martinez et al., 2009; Calvache, et al., 2011). Senthil Kumar et al. (2001) have used resistivity survey to determine aquifer characteristics. Nowadays, 2D- tomography survey is very common and commercial technique with the development of multi-electrode resistivity surveying instruments (Griffiths and Turnbull, 1985; Griffiths et al., 1990; Griffiths and Barker, 1993; Chien and Shih, 2007). Aquifer vulnerability to contaminants near solid waste landfill sites in a coastal environment was assessed using resistivity tomography by Ehirim and Ofor, (2010). In the High resolution electrical resistivity tomography (HERT), 2-D resistivity profile is obtained by use of multiple electrodes (Loke et al., 2010). This is a non-invasive method which provides the information about subsurface and assists in identification of seawater intrusion. The advantages of 2-D imaging surveys is the interpretation depend on 100 to 1000 measurements, while a typical 1-D resistivity sounding surveys usually involve 10 to 20 readings (Dahlin, 1996). The obtained data can be presented in the form of sub-surface images (Loke and Barker, 1995; 1996). The costal aquifer located in south of Chennai, the fourth largest city of India, is under tremendous stress due to rapid urbanization. Hence, it is necessary to frequently assess the extent of seawater intrusion in this aquifer to devise management methods to prevent degradation of groundwater quality. The present study was carried out with the objective of assessing the zone of mixing between seawater and groundwater in south of Chennai, Tamil Nadu, India using HERT. Groundwater quality of this region was earlier reported by Gnanasundar and Elango, (1998; 1999) have carried out vertical electrical sounding in several locations in this area to understand the groundwater quality variations. However, these studies have not attempted to correlate the geophysical data with groundwater quality. The present study was carried out in the coastal area south of Chennai, India during May 2008. MATERIALS AND METHODS HERT was carried out in the present study using a multi-electrode resistivity imaging system IRIS SYSCAL Pro-96. This is a multi-electrode system capable of connecting 96 electrodes using multi-core cable with the resistivity meter. Wenner-Schlumberger configuration was used in this study as this is a hybrid configuration between Wenner and Schlumberger which enable noise reduction and capable of deeper penetration (Loke et al., 2010). Resistivity profiling was carried out in five profiles (Fig. 1) perpendicular to the sea with 2.5 m or 5 m inter-electrode separation in the month of May 2008. The profiles were chosen in such a way that the surface area is reasonably flat. The maximum length of the profile was 170 m which resulted in a depth of investigation of 28.7 m. The length of the profiles surveyed, depends on the availability of free stretch land. The resistivity data obtained are inverted to create a pseudo-section of resistivity along a section making use of RES2DINV. This program is commonly used to create a model from pseudo-section (Sasaki, 1992). Thus, a model of earth subsurface and geoelectric sections were created. Furthermore, in order to compare with the resistivity data, borehole log of 33 wells of this area were also collected (Fig. 1) from Central Groundwater Board. These borehole logs were used to create subsurface block diagram making use of 3D visualization in Rockworks 2004 software. The subsurface block diagram created was used to get the lithological section along the geoelectric profile. This was used to check the lithological interpretation made from resistivity section. For the purpose of confirming the interpretation with regard to mixing of seawater made from resistivity section groundwater samples were collected during May 2008 from 50 wells distributed over the study area (Fig. 1). The samples collected were analyzed for electrical conductivity (EC), sodium (Na), chloride (Cl) Carbonate (CO3) and bicarbonate (HCO3). The EC was measured in the field using YSI professional plus multiprobe. The Na, Cl, CO3 and HCO3 were estimated as per the method suggested by APHA et al.(1998). The ratio of Cl/(CO3 + HCO3) was also calculated, which is as an indicator of seawater mixing (Todd, 1959). The regional distribution of EC, Na, Cl and Cl/HCO3 ratio was prepared using ArcGIS software. These regional distribution maps were used to prepare concentration profiles. Description of the study area The atmospheric temperature varies seasonally with summer values ranging from 35 °C to 42 °C and in winter it ranges from 25 °C to 34 °C. The southwest monsoon prevails from July to September and the northeast monsoon is active from October to December (Gnanasundar and Elango, 1998). The average annual rainfall in this area is about 1200 mm. This area is bounded by water on all the four sides with Bay of Bengal in the east, Buckingham canal in the west, the Adyar River in the north and Muttukadu backwater in the south. Most of the time, Adyar River and the Muttukadu backwater consist of saline water except during times of severe monsoon runoff. The Buckingham canal carries contaminated water, mostly the domestic sewerage and presence of saline water from the sea. Topographically, the central part of the region is elevated along north-south with gentle slope towards east and west. The highest topographic elevation is about 12 m above msl towards the northern boundary. The land use and land cover map derived from IRS-LISS III (24-02-2004), represent the settlement is comparatively high towards north than in the south. Geology and hydrogeology The three dimensional subsurface geology of the study area was prepared by using borehole logs collected from Central Groundwater Board in Fig. 2. The precambrian gneiss of charnockitic composition is at the basement, which is covered by quaternary formation. The basement charnockitic rock is weathered in the top and the thickness of weathered zone varies from 1.5 m to 10.7 m. The quaternary formation predominantly consists of sand and clay, however in western boundary along Buckingham canal, clay is dominant. The thickness of quaternary formations varies from 7 m to 23.2 m. The thickness of quaternary formation is comparatively high towards north direction. Eolian dune and beach sands occur up to a few hundred meters along the coastal boundary. The quaternary formation and the weathered rock zone functions as a potential unconfined aquifer. The aquifer behaves like island because of saline water body on all four sides. The annual average groundwater level fluctuation in a year is around 1.36 m. The annual maximum fluctuation of watertable is noted as 2.94 m towards northern part of the area. The presence of sandy clay and silt near the Buckingham canal prevents infiltration of contaminated water from the canal to the quaternary sandy aquifer in the east. Groundwater is pumped from this aquifer to meet the partial requirement of the city by the government agencies. Apart from water supply from government agencies, the houses located in this region also has private well to meet their needs. RESULTS AND DISCUSSION HERT profile obtained from Wenner-Schlumberger configuration was compared with the lithologs and water quality parameter in the following sections. The results obtained from groundwater analysis of samples collected from ten wells closer to the resistivity profiles are given in Table 1. The CO3 is absent in this area and regional variation of EC, Na, Cl and Cl/HCO3 is shown in Fig. 3. Profile: A-A' In this profile A-A', resistivity survey was carried out for a length of 120 m at a distance of 10 m from the coast. High resolution electrical resistivity image over profile A-A' is shown in Fig. 4. The maximum apparent electrical resistivity measured in this profile is about 30000 ohm-m. The resistivity image was interpreted and the geological cross section (Fig. 5) was prepared by comparing with 3-D block diagram (Fig. 2). The depth to the water table interpreted from the resistivity image varies from 1 m to 4 m. The soil zone above the water table result into high apparent resistivity up to 9371 ohm-m. The quaternary formation extends up to a depth of 12.5 m. The lithological interpretation made from the resistivity image reasonably compare with lithological section arrived from 3-D block diagram (Fig. 6). The low apparent resistivity indicates the influence of seawater is over the entire saturated zone of this profile. The resistivity image indicating low resistivity zone correlated well of EC, Na, Cl and Cl/HCO3 ratio profile (Fig. 7). The groundwater of well no. 35 of 3.26 m deep located at a distance of about 65 m from the coast on the profile had EC of 3430 µS/cm. The EC of groundwater of well no. 37 of 4.59 m deep located at a distance of 130 m from the coast and 20 m south of the resistivity profile was EC of 3260 µS/cm. Profile: B-B' In this profile B-B' HERT survey was carried for a length of 100 m at a distance of 5 m from the sea. High resolution electrical resistivity image obtained over this profile is shown in Fig. 4. The resistivity image was interpreted and the geological cross section (Fig. 5) was prepared by comparing with 3-D block diagram (Fig. 2). The depth to the water table interpreted from the resistivity image varies from 1 m to 3 m. The soil zone above the water table result into high apparent resistivity up to 1297 ohm-m. The quaternary formation extends up to a depth of 11.5 m. The maximum apparent electrical resistivity measured in this profile is about 3000 ohm-m. The lithological interpretation made from the resistivity image reasonably compare with lithological section arrived from 3-D block diagram (Fig. 6). The low apparent resistivity indicates the influence of seawater is over 40 m of this profile. The resistivity image indicating low resistivity zone correlates well with the EC, Na, Cl and Cl/HCO3 ratio profile (Fig. 7). The groundwater of well no. 26 of depth 5.88 m located at a distance of 154 m from the coast showed EC of 2580 µS/cm. The groundwater of well no. 27 of 3.14 m depth located at a distance of about 222 m from the coast on the profile showed EC of2560 µS/cm. Profile: C-C' In this profile C-C', survey was carried out for a length of 100 m at a distance of 10 m from the sea. High resolution electrical resistivity image obtained over C-C' profile is shown in Fig. 4. The maximum apparent electrical resistivity measured in this profile is about 4000 ohm-m. The geological interpretation arrived from the resistivity image (Fig. 5) by comparing with 3-D block diagram (Fig. 2). The depth to the water table interpreted from the resistivity image varies from 1 m to 3.5 m. The soil zone above the water table results in high apparent resistivity up to 4000 ohm-m. The quaternary formation extends up to a depth of 11.5 m. The lithological interpretation made from the reasonable compare of resistivity image with lithological section arrived from 3-D block diagram (Fig. 6). The low apparent resistivity indicates the influence of seawater is over 50 m of this profile. The resistivity image indicating low resistivity zone correlates well with the EC, Na, Cl and Cl/HCO3 ratio profile (Fig. 7). EC of groundwater of well no. 23 of 5.15 m depth located at a distance of about 130 m from the coast was 1565 µS/cm. EC of groundwater was 1552 µS/cm in well no. 22 of 4.97 m deep located at a distance of 224 m from the coast. Thus, these measurements support the interpretation made from the resistivity image. Profile: D-D' In this profile, survey was carried out for a length of 100 m at a distance of 5 m away from coast. Electrical resistivity image obtained over D-D' profile is shown in Fig. 4. The maximum apparent electrical resistivity measured in this profile is about 200 ohm-m. The geological cross section is shown in Fig. 5. Depth to the water table interpreted from the resistivity image varies from 1 m to 4 m. High apparent resistivity up to 51 ohm-m was measured in the soil zone. The quaternary formation extends up to a depth of 15.5 m. The lithological interpretation made from the resistivity image reasonably compare with lithological section arrived from 3-D block diagram (Fig. 6). Influence of seawater is noticed up to a distance of 47.5 m as indicated by low resistivity. Low resistivity zone corresponds with the profile of EC, Na, Cl and Cl/HCO3 ratio (Fig. 7). EC of 2310 µS/cm was measured in groundwater of well no. 18 of 3.70 m deep located at a distance of about 120 m from the coast near this profile. Where as EC of 330 µS/cm was measured at a distance of 252 m from the coast in well no.19 of 6.89 m deep. Hence, in this case the distance of mixing of seawater with groundwater is comparatively less then all the other remaining profiles. Profile: E-E' Electrical resistivity image obtained in this profile for a length of 170 m at a distance of 80 m from the coast is shown in Fig. 4. The resistivity image was interpreted and the geological cross section (Fig. 5) was prepared by comparing with 3-D block diagram (Fig. 2). The depth to the water table interpreted from the resistivity image varies from 1 m to 4 m. The soil zone above the water table results in a high apparent resistivity up to 6000 ohm-m. The quaternary formation extends up to a depth of 11.2 m. The lithological interpretation made from the resistivity image reasonably compare with lithological section arrived from 3-D block diagram (Fig. 6). The low apparent resistivity indicates the influence of seawater up to a distance of 120 m in this location. Low resistivity zone due to seawater mixing correlates well with the profile of EC, Na, Cl and Cl/HCO3 ratio (Fig. 7). EC of groundwater was 1628 µS/cm (well no. 15 of 6.27 m deep) at a distance of about 83 m from the coast. EC of 1385 µS/cm was measured in well no. 16 of 4.28 m deep located at a distance of 160 m from the coast. CONCLUSION Resistivity images obtained in profiles perpendicular to the sea helped to interpret the subsurface geology. The lithological profile of resistivity pseudo section compares well with borehole logs of nearby wells. Maximum apparent resistivity of around 30000 ohm-m indicated the hard rock zone. Resistivity images indicate the influence of seawater mixing with freshwater. Groundwater sampling and analysis also support the interpretation made by HERT. The EC, Na, Cl and Cl/HCO3 of groundwater variation from the sea along the resistivity profiles confirm mixing of seawater. Influence of seawater on groundwater zone is maximum in the northern most profile indicating over extraction groundwater near to the city. Thus, this work demonstrated the application of electrical tomography in identification of seawater mixing with freshwater. HERT holds promise to be a powerful tool in the investigation of subsurface geology and seawater mixing in coastal aquifers. This method is advantageous as it is rapid and low cost, producing high resolution images to identify seawater mixing. Rapid identification for seawater mixing zone will help in proper and efficient management of coastal groundwater resources. ACKNOWLEDGEMENTS The first two authors wish to acknowledge the Department of Science and Technology, India (Grant: SR/S4/ES-21/ Cauvery /P6 and SR/FST/ESI-106/2010) and University Grants Commission, India (Grant: UGC DRS II F.550/10/DRS/2007) for providing research grant to carry out this work. REFERENCES
© IRSEN, CEERS, IAU The following images related to this document are available:Photo images[st11044f6.jpg] [st11044f5.jpg] [st11044f2.jpg] [st11044f1.jpg] [st11044f7.jpg] [st11044t1.jpg] [st11044f4.jpg] [st11044f3.jpg] |
| |||||||||
