 |
| About Bioline | All Journals | Testimonials | Membership | News |
|
||||||
|
||||||
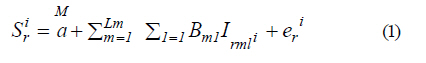
International Journal of Environment Science and Technology, Vol. 8, No. 3, 2011, pp. 523-532 Customer concerns about uncertainty and willingness to pay in leasing solar power systems *L. H. Shih; T. Y. Chou Department of Resources Engineering, National Cheng Kung University, Tainan, Taiwan *Corresponding Author Email: lhshih@mail.ncku.edu.tw Tel./ Fax: +886 6275 7575 Received 21 June 2010; revised 14 January 2011; accepted 22 March 2011 Code Number: st11048 ABSTRACT: Although solar power systems are considered as one of the most promising renewable energy sources, some uncertain factors as well as the high cost could be barriers which create customer resistance. Leasing instead of purchase, as one type of product service system, could be an option to reduce consumer concern on such issues. This study focuses on consumer concerns about uncertainty and willingness to pay for leasing solar power systems. Conjoint analysis method is used to find part worth utilities and estimate gaps of willingness to pay between attribute levels, including various leasing time lengths. The results show the part worth utilities and relative importance of four major attributes, including leasing time. Among concerns about uncertainties, government subsidy, electricity price, reliability, and rise of new generation solar power systems were found to be significantly related to the additional willingness-to-pay for a shorter leasing time. Cluster analysis is used to identify two groups standing for high and low concerns about uncertainty. People with more concerns tend to pay more for a shorter lease time. Keywords: Conjoint analysis; Leasing time; Part worth utility; Photovoltaic system INTRODUCTION As energy shortages and the environmental impact caused by using fossil fuels get more attention, renewable energy has become a worldwide focus. Research and product development of new and renewable energy have thus become more important in recent years. Among the renewable energy sources, solar power systems are one of the most promising. Since it is considered clean and sustainable to transform solar energy directly to electricity, many countries have announced that photovoltaic energy is going to play an essential role in electricity generation in the near future. EPIA (2009); Karbassi et al. (2010); Mostofi et al. (2011) estimated that overall annual installation of photovoltaic systems will increase by more than three times by 2013. In fact, overall installation has grown 15 times from 1998 to 2008. For example, Taiwan's installed capacity has increased from 3 KW to 2060 KW from 2000 to 2007. Recently, local government has also announced that electricity obtained from renewable energy will reach more than 11 % (4.9 GW) of the total electricity generation by 2015. In this forecast, solar power capacity is expected to reach 310 MW, which implies a dramatic growth from now to 2015. As an emerging energy supplier, there are several competing solar energy technologies, such as c-Si technology, thin film technology and other new technologies. According to one technology forecast (Bagnall and Boreland, 2008), the cost and efficiency of solar energy technology will greatly improve in the next 20 years. Among these technologies, thin film technology could have more improvement (i.e., up to 30% cost reduction) than silicon-based technology. Hoffmann et al. (2004) estimated that the market share of thin film technology will increase from 5 % (2005) to 35 % (2030), while that of other new technologies, such as chemical compound technology, might increase from 0 % (2005) to 35 % (2030). These technology forecasts point out the tremendous growth potential of solar power systems, but also reveal that there will be dramatic changes and competition among various solar power technologies, which could raise concerns about uncertainty from a consumer point of view. In light of these technology forecasts and a growing awareness of sustainability, how solar power adoption transits from this stage to the next stage is an interesting question. Price and risk due to uncertainty are two major issues that should be considered. The cost of such technology is expected to be lower if the government provides more incentives and technology itself improves as forecast. However, one question remains: even as the price falls to a certain level, will consumers adopt the system without hesitation? This study focuses on the second factor that may play an important role in solar power system diffusion, which is the uncertainty that may hinder new product adoption. Since photovoltaic technology is still an emerging technology, consumers are often concerned about uncertain factors like an inconsistent government incentive policy, the changing price of electricity, reliability and maintainability, product lifetime, energy efficiency, and phase-out speed. It is essential to deal with these concerns in order to expedite the growth of the solar power system market. Service providers could expand their market share by overcoming these worries and identifying potential customers with high levels of concern. The current work and survey were conducted in Taiwan in December of 2009. Leasing solar power system As one type of product service systems, leasing instead of purchase may reduce consumer worry about the uncertainties, especially for expensive new products (Mont, 2004). By leasing a solar system, consumers can get electricity without actually owning it for more than 20 years, and the risk due to uncertain factors is thus shared by service providers and customers. If market installation increases due to leasing, it may be a good example of product service system implementation in the renewable energy area. In fact, there are already some leasing service providers for solar power systems in the US, where customers can choose the leasing term from one, five, ten or fifteen years. Service providers take care of the installation, maintenance and repair of the system. The rent may be fixed or adjustable following local electricity prices. Service providers generally do not charge rent if the system is broken or under maintenance. When the lease term is up and users want to extend it, service providers will upgrade the system for free. In light of the existing leasing services for photovoltaic power systems, this study examines consumer preferences and willingness-to-pay (WTP) for such a service using conjoint analysis. Major attributes that are considered in solar power system leasing are included in the conjoint analysis model. Multiple attribute utilities (part worth utilities) of consumer preferences are estimated. Gaps in the WTP from one attribute level to another are also estimated. The time period for leasing is intentionally chosen as one of the attributes to investigate the WTP with various leasing times. In addition, consumer concerns about several uncertain factors are measured. The main research question is how much consumers are willing to pay to reduce the risk of uncertainty by adopting leasing instead of purchase. Specifically, is there a relationship between concerns about uncertainty of solar systems and the willingness to pay for shorter term leasing? Section 3 of this work discusses the uncertain factors in adopting solar energy systems while section 4 presents the conjoint model to find the part worth utility (PWU) and willingness to pay. Section 5 presents the results of the conjoint analysis for the part worth utilities. Concerns about the uncertain factors are also estimated. Consumers are divided into two groups based their levels of concerns. Section 6 shows the gap in the WTP between different leasing times. Most importantly, since the lifetime of a solar system is approximately 20 years, a leasing time of more than 20 years is interpreted as a purchase, so that the gap in WTP between leasing and purchase can be obtainable. Finally, section 7 presents the concluding remarks of this research work. Uncertain factors in adopting photovoltaic electricity systems Uncertainty factors could cause resistance in adopting many innovative products, not only solar power systems. Ram and Sheth (1989) stated that there are three major barriers to adopt innovations, including value, usage and risk. The value barrier means the innovation's inability to produce economic-or performance-based benefits, while use barrier means an innovation may not be compatible with existing workflows, practices and habits. The third barrier to adopt innovative products is the risk barrier, which includes physical, functional, economic and social risks (Nouri et al., 2011). Customers, aware of the risks, could postpone adopting an innovation until they could learn more about it or avoid the risks. Cox et al. (2007) noted that consumers are cautious about accepting novel technologies because of the perceived risk and lack of benefits (Tehrani et al., 2009). They used a conjoint model to study consumers' perceived risk, benefits, need, unnaturalness and safety of the technologies. Participants were segmented by the sum of their beliefs about the novel technologies. Since photovoltaic technologies are still in a fast changing stage of their development, consumers are also very cautious in adopting the technology. If the value barrier could be overcome by government subsidy or future cost reduction, the risk barriers may remain another concern that limits the market. Risk barriers could be caused by several uncertain factors such as varying government subsidies, price, product lifetime, reliability and maintainability, replacement by new generation technology and the price of electricity, which heavily depends on changing fossil fuel prices. This study focuses on risk barriers to adopting solar power systems. Six uncertain factors are considered herein, all of which appear in the literature: 1) Government policies about subsidies, tax reduction and buying back electricity may vary depending on priority and consistency with regard to a renewable energy strategy. Before the price of solar power systems fall to a level near that of traditional electricity sources, this is the main economic uncertainty (Goett et al., 2000; Bartels et al., 2004). 2) Price is directly related to cost, which may vary due to the supply of raw materials, technology improvement, production learning effect and economic scale. This factor may be the most important concern to consumers (Berger 2001), although consumers would eventually pay a price which is reduced by government subsidy. 3) The lifetime of a photovoltaic electricity system is about 20-30 years, and variations in this would affect the pay back period of the installation (Bartels et al., 2004; Cox et al., 2007). 4) Reliability and maintainability are also concerned. High reliability of a home electricity supply is expected for most consumers, especially in developed countries (Berger 2000; Goett et al., 2000; Longo et al., 2008). 5) Improvement in the efficiency and speed of new generation products are also a concern, as consumers are worried about buying a product that will soon be obsolete (Batley et al., 2001; Berger 2001; Cox et al., 2007). 6) Price variations of electricity that is generated from traditional fuel sources are very important, since traditional electricity providers are the competitors of solar power systems. As the price of fossil fuel varies often, the traditional electricity price is an important uncertainty (Goett et al., 2000; Roe et al., 2001; Bergmann et al., 2006; Longo et al., 2008). Before designing the questionnaire, field interviews were conducted to verify the uncertain factors of concern to customers. Questions about whether the respondents were concerned about various uncertain factors when considering adopting a solar energy system were included in the questionnaire and a five-point Likert scale was used to collect their degree of concern six uncertainty factors. These responses were then used to find the relationship between consumer adoption and WTP. MATERIALS AND METHODS Conjoit model and estimation of willingness to pay The conjoint model has been widely used in new product development (Green and Srinivasan 1990) to estimate consumers' utility function and find the preference structure. The PWU estimation of important attributes could be helpful in detecting consumer responses to a new product and provide feed-back to the product development process for further improvements. Recently, conjoint analysis has also been used in new service design evaluation; good examples of this include: Chau et al. (2003); Danielis et al. (2005); Kohne et al. (2005); Lockshin et al. (2006); Enneking et al. (2007). In this study, the new service design of leasing solar power systems is considered by using conjoint analysis. Capacity, payment per month, lease time and reliability are included in the service design.PWU of these four attributes are estimated and expected to show a better design with greater acceptance (i.e. larger utility value) by customers. In general, there are three major parts in conjoint analysis. First, important attributes that are major concerns of customers about the new products must be carefully selected. Secondly, hypothetical product profiles that are combinations of different attribute levels are presented to customers to collect their opinions or choices. Finally, regression analysis is conducted to estimate respondents' PWU for all the attributes. In this study, conjoint analysis is conducted as follows: 1) Select important attributes and attribute levels of solar energy systems: when consumers consider a solar energy system, many attributes could be considered, such as price, capacity, reliability, maintenance and efficiency. In this study, lease time is included to find out the utility of leasing duration. The levels of leasing time are selected as 5, 15 and 20 years, with 20 years considered as purchase. Payment per month for leasing is selected as one attribute so that gaps in WTP can be calculated for comparison. Other attributes selected include monthly payment, capacity and frequency of break down. Table 1 shows the attributes and their levels. The attribute levels of capacity and monthly payment are defined based on the ranges of actual electricity usage. Taking Taiwan as an example, if an average family uses a solar system to replace conventional electricity with a capacity of 3-4 peak kW, it would cost 700,000 NT dollars (1 US dollar is approximately 32 NT dollars). Even with a government subsidy, a family would need to pay more than 580,000 NTD to purchase the system, which means a monthly payment of 3,200 NTD dollars. As for the reliability concern, Goett et al. (2000) and Longo et al. (2008) suggested that when a solar energy system breaks down more than three times per year, its reliability would be considered a serious problem. 2) Construct preference model: Several types of conjoint models have been proposed since the method was first proposed in the 1970s. The mathematical form of the multiple attribute utility function could additive, multiplicative or nonlinear, while the evaluation could be a ranking, rating, or comparison. This study presents a classic conjoint model, where the addition of main effects is adopted. To aid the ensuing discussion, the following notations are used.:
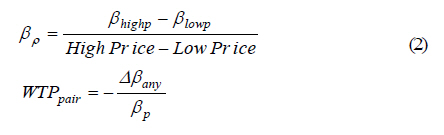
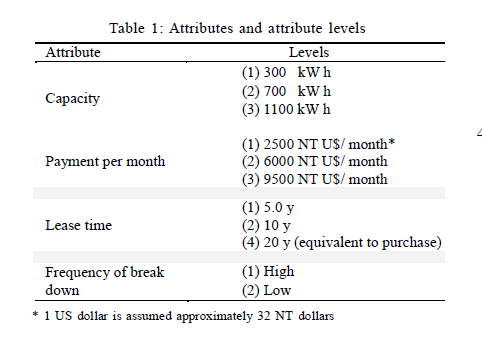
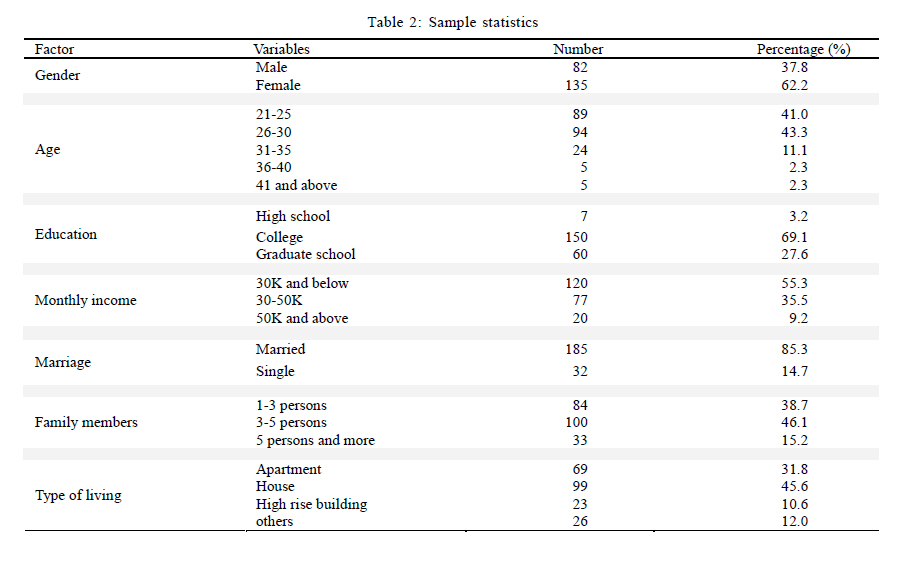
m: Denotes the index for an attribute. Assume there are M attributes, i.e., m = 1, 2, …, M. Here M = 4. l: is the level for an attribute, for example, l = 1, 2, …, Lm denoting the level of the mth attribute. sri: is the evaluation rating obtained for the rth full profile from respondent i. r: is the index for the full profile, where r = 1,…, R, and R: is the total number of profiles. The preference model is in regression model form: where Irmli equals 1 when the rth full profile matches the level l at the mth attribute; otherwise, Irmli equals 0. In regressing the data, sri and Irmli are adopted from the respondents' ratings. It should be noted that a and Bml are regression parameters in expression (1), while eri is an error term. The parameters can be estimated by simultaneous or stage wise regression. The parameter Bml is the part worth value at the level l of the mth attribute. 3) Build solar power system profiles with factorial design: In conjoint analysis, combinations of product profiles are presented to consumers and they are asked for their ratings and willingness to adopt the related products. Profiles of different solar power systems are made according to combinations of all the attributes levels. Since 3 x 3 x 3 x 2 = 54 profiles are too many, a factorial design is used to build the product profiles in the questionnaire design. Respondents would give a rating of willingness for each product profile, then these ratings are used in regression analysis in order to estimate the PWU of the attributes. The hypothetical product profiles were presented verbally, as a list of attributes and levels. 4) Questionnaire survey and data collection: In this study, local consumers were sampled in a questionnaire survey that consists of three parts, including respondents' background, hypothetical product profiles for conjoint analysis and concerns about uncertainty in adopting a solar power system. The questionnaire survey was conducted via the internet, with popular web sites and Bulletin board systems (BBS) are selected to publicize it. A web site was set-up for the on-line questionnaire and collecting responses. 317 responses were collected within a month. The respondents aged less than 21 were removed to better represent the population who may actually purchase solar power systems and the effective sample size was then reduced to 217 (70 %). Table 2 shows the statistics of the sample. 5) Conduct statistical analysis and result analysis: Conjoint analysis provides estimates of the part worth utilities of all attributes. As indicated in expression 1, PWUs are estimated using coefficients of the regression model. Commercial software, like SPSS, can be used to conduct the regression analysis and present the part worth utilities. Since the utility corresponding to each attribute level can be estimated, the shape of the utility function for each attribute (i.e. part worth utility) can be obtained. Furthermore, Green and Wind (1975) suggested that the range of PWU of an attribute represents the relative importance of this attribute. Contingent valuation and conjoint analysis are two popular methods to determine WTP. Some good examples of the application of the contingent valuation method to environmental and energy issues are as follow. Wiser (2007) explored WTP for renewable energy, while Koundouri et al. (2009) estimate WTP for wind farm construction. Yoo and Kwak (2009) used the dichotomous choices method to estimate WTP for green electricity in Korea. Solomon and Johnson (2009) used a multi-part, split-sample contingent valuation method to find WTP for biomass ethanol. Other recent studies are: Hansla et al. (2008); Scarpa and Willis (2010); Afroz et al. (2009). In addition, conjoint analysis is often used to estimate WTP when the attributes and attribute levels of products or services are important. Recent examples of this include Hurlimann et al. (2007) for the WTP of recycled water, Borchers et al. (2007) for different green energies, Banfi et al. (2008) for energy-saving measures in residential building, Longo et al. (2008) for renewable energy and Tehrani et al. (2010) for energy conserving by e-shopping. Ladenburg and Dubgaard (2009) used a choice-based model to find the preferences and WTP for offshore wind farms, Chau et al. (2010) studied WTP for green building attributes, while Aguilar and Cai (2010) analyzed the effect of environmental labeling and disclosure of forest of origin and WTP for wood products. This study uses the conjoint analysis method to estimate WTP because the gaps of WTP between attribute levels are of interest. To estimate WTP, price / payment must be selected as one attribute (Imandoust and Gadam, 2007). The WTP can be calculated using Eq. 2 where differences in PWU between any pair of attribute levels is used to multiply the price coefficient. The price coefficient can be obtained using the price difference and the PWU difference of the price attribute.
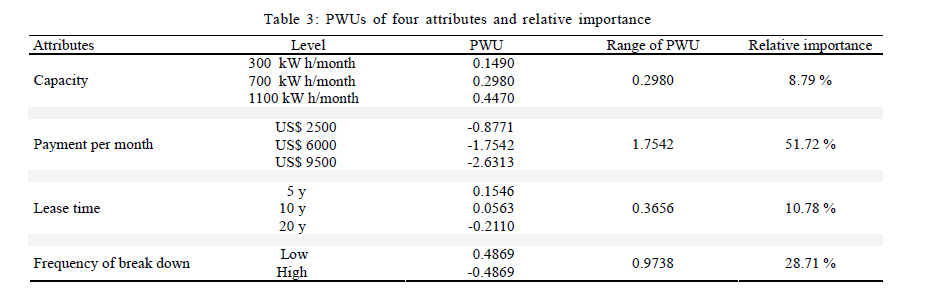
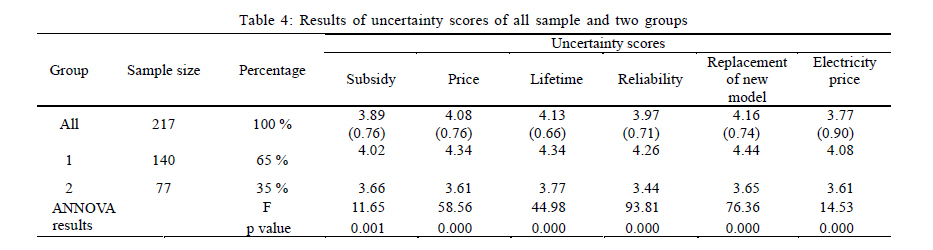
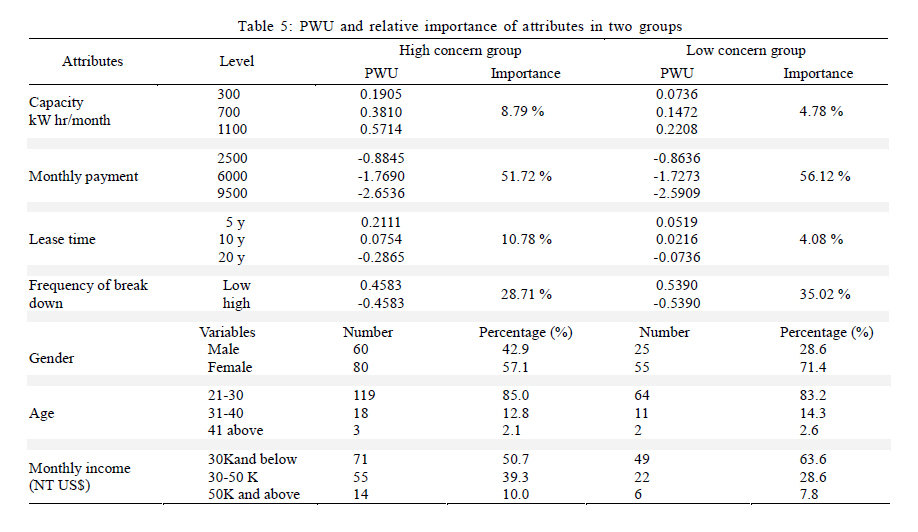
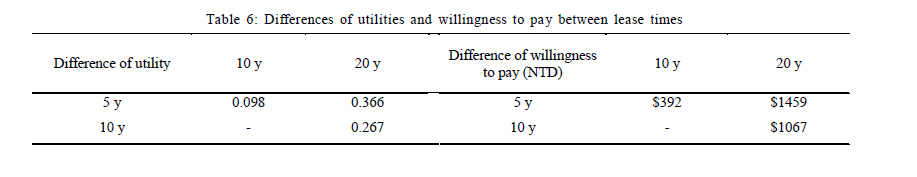
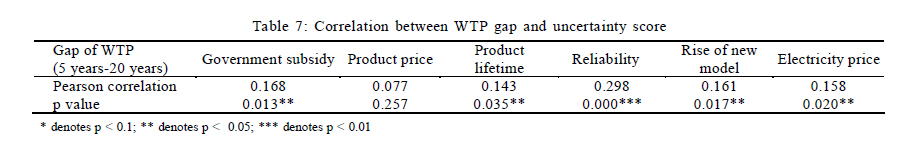
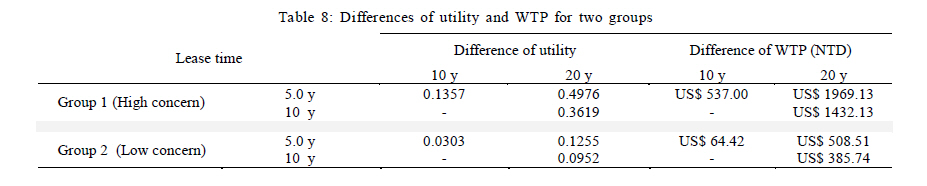
βp: Price coefficient βhighp: PWU of the higher level of price attribute βlowp: PWU of the lower level of price attribute HighPrice: Higher level of price LowPrice: Lower level of price WTPpair: Gap of WTP between the selected pair of attribute levels Δβany: PWU difference between levels of other attribute RESULTS AND DISCUSSION The PWU of the four attributes are obtained using conjoint analysis. Table 3 shows the PWU and the relative importance based on the ranges of the PWU. Payment per month is the most important attribute (51.7 %) while electricity capacity is the least important (8.8 %) and Leasing time is ranked as the third (10.8 %). In the questionnaire, a five-point Likert scale was used to measure the level of concern about the uncertain factors; Table 4 shows the results for government subsidy, price, lifetime, reliability, being replaced by a new model and electricity price. For the overall sample, being replaced by new model, lifetime and price are of most concern, with average scores greater than 4 (5 represents very concerned). Concern about reliability is also high. Cluster analysis is used to see if there are any significant differences between concerns about uncertainty. The bottom half of Table 4 shows two clusters with significantly different opinions about uncertain factors, obtained using analysis of variance (ANNOVA). Group 1 with the higher concern scores is named the "high concern group", while group 2 is called the "low concern group". Table 5 shows the relative importance of the four attributes from the responses of the two groups. The higher concern group ranks lease time the third, while the lower concern group ranks it the fourth. The percentage of female in group 2 is higher than in group 1. The average age of the first group is slightly younger than the second group. Finally, Group 1 has a higher income than group 2. Gap of WTP between leasing and purchase After obtaining the part worth utilities of all attributes, the WTP for each pair of attribute levels can be calculated using Eq. 2. The gap of PWU is transformed to the gap of WTP. For example, Table 6 shows the utilities between different lease times as well as the gaps of WTP between pairs of lease times. Consumers are willing to pay an extra 1,459 NTD dollars on average to choose a five-year lease rather than a 20-year lease. Leasing for 20 years means a long term commitment and this could be interpreted as a purchase. Compared to the monthly worth (3,200 NTD) of purchasing a solar power system, the extra payment of 1,459 NTD is about 45 % of the purchase price. The gap of WTP implies that consumers are willing to pay 45 % more to take an option of leasing the system for five years instead of purchasing it. This can also be seen as a payment to avoid the risk of holding a solar system for more than 20 years. The difference in WTP between leasing for five years and ten years is 392 NTD, while the difference in WTP between leasing ten years and 20 years is 1,067 NTD. Another interesting question is whether concerns about the uncertain factors are related to the WTP between short term leasing and purchase. People with more concerns about uncertainty and more resistance to adopting new products are expected to choose shorter term leases. Table 7 shows the correlation between the gap of WTP and the concern about uncertain factors using Pearson correlation. The gap of WTP between lease times is highly correlated with most uncertain factors, namely government subsidy, product lifetime, reliability, release of new models and electricity price. The only uncertainty measure that is not significantly related to the gap of WTP is product price. Among the uncertainty scores, the score on reliability is highly correlated with gap of WTP. Concern about product lifetime has the least correlation with the gap of WTP. Table 4 shows that there is significant difference in uncertainty recognition between groups one and two. Group one has a higher score on concerns about uncertainty in all six measures. The WTP for groups of higher and lower concerns about uncertain factors and differences in utility and WTP between different lease times, are shown in Table 8. Group 1 has larger gap of WTP between lease times, meaning people with more concern about uncertainty prefer shorter lease times to avoid risk. Taking the comparison between five- and 20-year lease times as an example, group 1 is willing to pay an extra 1,969 NT dollars for a five-year lease than a 20-year one. The extra payment per month is larger than that (508 NTD) offered by group 2. Comparing the lease times of five and ten years, group 1 are willing to pay an extra 537 NTD, which is larger than that (64 NTD) group 2 is willing to pay. This result supports our hypothesis that short term leasing would be preferred by people who have more concern about uncertain factors. CONCLUSION Solar power systems are seen as one of the most promising renewable energy sources that may be adopted by consumers in the near future. However, since there are many uncertain factors in adopting emerging technology, leasing rather than purchasing might be an option that helps consumers to reduce their risk and worry. This study focuses on the willingness to pay for leasing comparing to purchasing. A questionnaire survey of consumer concerns about some uncertain factors that may affect the adoption of solar power system is conducted, while conjoint analysis is used to estimate the PWU and the WTP of various attributes. By including lease time as an attribute in the conjoint model, gaps of willingness-to-pay between shorter and longer leasing times could be estimated. Since a leasing time longer than 20 years is equivalent to purchase, the gap of WTP between shorter leasing time and purchase was estimated. In addition, the relation between the gap of WTP of different lease times and uncertainty scores that measure consumer concerns are presented. The gap of WTP between lease times is highly correlated to uncertain factors, like government subsidy, product lifetime, reliability, release of new models and electricity price. Cluster analysis is used to identify two groups with high and low concerns about uncertainty. People with more concerns about uncertainty are willing to pay more for a shorter lease time. It is essential to deal with these concerns about uncertainty in order to expedite the growth of the solar power system market. Leasing service providers could expand their market share by overcoming these uncertainties and identifying potential customers with higher levels of concern. ACKNOWLEDGEMENTS Authors would like to thank National Science Council for providing financial support to this study (NSC 96-2621-Z-006- 002-MY3). REFERENCES
© IRSEN, CEERS, IAU The following images related to this document are available:Photo images[st11048t1.jpg] [st11048t7.jpg] [st11048t3.jpg] [st11048t2.jpg] [st11048t8.jpg] [st11048t4.jpg] [st11048t5.jpg] [st11048t6.jpg] |
| |||||||||
