 |
| About Bioline | All Journals | Testimonials | Membership | News |
|
||||||
|
||||||
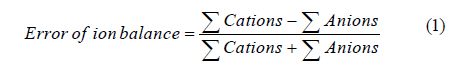
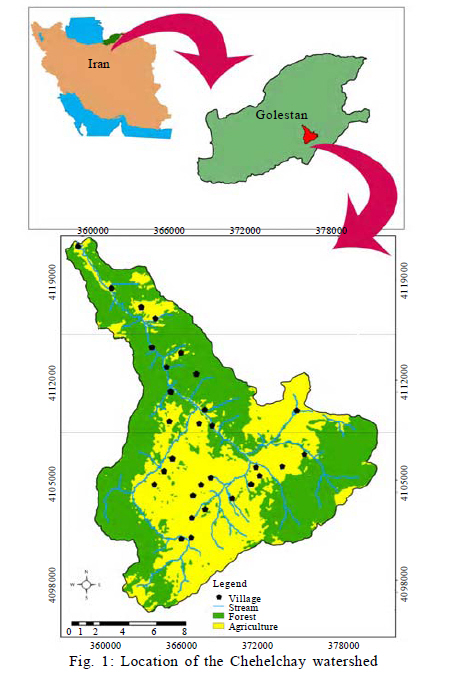
International Journal of Environment Science and Technology, Vol. 8, No. 3, 2011, pp. 581-592 Assessment of seasonal variations of chemical characteristics in surface water using multivariate statistical methods A. Zare Garizi; *V. Sheikh; A. Sadoddin 1 Department of Watershed Management, Gorgan University of Agricultural Sciences and Natural Resources, Gorgan, Iran *Corresponding Author Email: v.sheikh@yahoo.com Tel.:+98171 224 5965; Fax: +98171 224 5886 Received 24 November 2010; revised 19 January 2011; accepted 9 March 2011 Code Number: st11054 ABSTRACT: Water pollution has become a growing threat to human society and natural ecosystems in the recent decades. Assessment of seasonal changes in water quality is important for evaluating temporal variations of river pollution. In this study, seasonal variations of chemical characteristics of surface water for the Chehelchay watershed in northeast of Iran was investigated. Various multivariate statistical techniques, including multivariate analysis of variance, discriminant analysis, principal component analysis and factor analysis were applied to analyze river water quality data set containing 12 parameters recorded during 13 years within 1995-2008. The results showed that river water quality has significant seasonal changes. Discriminant analysis identified most important parameters contributing to seasonal variations of river water quality. The analysis rendered a dramatic data reduction using only five parameters: electrical conductivity, chloride, bicarbonate, sulfate and hardness, which correctly assigned 70.2 % of the observations to their respective seasonal groups. Principal component analysis / factor analysis assisted to recognize the factors or origins responsible for seasonal water quality variations. It was determined that in each season more than 80 % of the total variance is explained by three latent factors standing for salinity, weathering-related processes and alkalinity, respectively. Generally, the analysis of water quality data revealed that the Chehelchay River water chemistry is strongly affected by rock water interaction, hydrologic processes and anthropogenic activities. This study demonstrates the usefulness of multivariate statistical approaches for analysis and interpretation of water quality data, identification of pollution sources and understanding of temporal variations in water quality for effective river water quality management. Keywords: Discriminant analysis; Factor analysis; Multivariate analysis of variance; Principal component analysis; Water quality INTRODUCTION Rivers and their catchments are highly important parts of the natural heritage. Rivers have been utilized by mankind for thousands of years to the extent that few of them are now in their natural condition (Ngoye and Machiwa, 2004). Human and ecological use of in-stream water requires to be considered for both the quantity and the quality of water (Chang, 2008; Masamba and Mazvimavi, 2008). Water quality is important to assess the health of a watershed and to make necessary management decisions to control current and future pollution of receiving water bodies (Khadam and Kaluarachchi, 2006; Behbahaninia et al., 2009). The information on water quality and pollution sources is important for implementation of sustainable water-use management strategies (Sarkar et al., 2007; Zhou et al., 2007; Nouri et al., 2008a; Bu, et al., 2009; 2010; Soner Kara and Onut, 2010). The chemical composition of surface water and its properties in a particular region is basically governed by natural processes such as precipitation rate, weathering processes, soil erosion and anthropogenic effects which is point or non-point sources of pollution such as urban, industrial and agricultural activities (Jarvie et al., 1998; Giridharan et al., 2009; Nouri et al., 2009; 2011). Seasonal variations in precipitation, surface run-off, ground water flow, interception and abstraction strongly affect river discharge and consequently the concentrations of chemical compositions of river water (Vega et al., 1998; Khadka and Khanal, 2008; Mtethiwa et al., 2008; Juang et al., 2009; Pejman et al., 2009). Pollutants entering a river system normally result from many transport pathways including storm water runoff, discharge from ditches and creeks, vadose zone leaching, groundwater seepage and atmospheric deposition (Ouyang et al., 2006; Nouri et al., 2008b; Jha et al., 2010). These pathways are also seasonal-dependent. Therefore, seasonal changes in surface water quality must be considered when establishing a water quality management program (Ouyang et al., 2006). To provide a reliable estimation of surface water quality, monitoring programs attempt to include frequent water sampling at numerous sites and perform full analysis of water for a large number of physicochemical parameters. Therefore, these programs usually yield large data matrices (Boyacioglu et al., 2004). Interpretation of water quality data matrices for extracting useful information and effective management of surface water can be approached through the use of multivariate statistical methods, which can be called environmetrics. Environmetrics, also known as chemometrics, can be considered as a branch of environmental analytical chemistry that uses multivariate statistical modeling approaches such as regression, Discriminant analysis (DA), Cluster analysis (CA) Principal component analysis (PCA) and Factor analysis (FA) (Simeonov et al., 2000; Juahir et al., 2010). Environmetrics is deemed to be one of the best approaches to reveal the information which is concealed in the quality variables observed in water quality monitoring networks and avoid misinterpretation of large complex monitoring data (Mazlum et al., 1999; Simeonov et al., 2002). Multivariate statistical techniques have been applied to characterize and evaluate freshwater quality; they are useful in verifying temporal and spatial variations caused by natural and anthropogenic factors linked to seasonality (Helena et al., 2000; Singh et al., 2005; Shrestha and Kazama 2007). Multivariate analysis of variance (MANOVA) determines if there are any significant differences between several groups of multivariate data. DA determines the variables that discriminate between groups by constructing a discriminant function (DF) (Singh et al., 2005). FA attempts to explain the correlations between the observations in terms of the underlying factors, which are not directly observable (Yu et al., 2003). It helps in identifying the possible factors / sources that influence water quality (Reghunath et al., 2002; Panda et al., 2006; Bu et al., 2009a). In this study, the Chehelchey River in Golestan province in Iran was chosen for water quality assessment. The Chehelchay River is one of the largest tributaries of the Gorganrood River. Currently, the watershed of the Chehelchay River is the water source for about 14000 inhabitants in rural areas, 30 villages, within the watershed as well as urban areas and agricultural fields in the downstream of the watershed. In near future, the Narmab-Chehelchay dam is going to be constructed at the downstream of the Chehelchay River by the local water authorities. This dam is planned to provide water supply, particularly potable water of Minoodasht and other adjacent cities. This is while the Chehelchay watershed has long been subjected to land-use change from forest to croplands and suffers from severe soil erosion. Thus, there is a growing concern about the potential effects of extensive land-use change and resultant changes in hydrological conditions on the availability and quality of the water from this watershed. Despite its significance, there is a lack of knowledge and understanding regarding the water quality of the Chehelchay River and its variation through the seasons. Therefore, this study attempts to facilitate the understanding of system behavior with respect to water quality issues and management within the Chahelchay watershed in the Golestan province, Iran. This study was carried out over the period August 2009 through August 2010. The objectives of this study are; 1) To examine the seasonal variations of river water quality parameters recorded during 13 years monitoring during 19952008; 2) To determine the important discriminant variables; and 3) To identify factors and sources influencing the chemistry of the river water. The overall aim of the present study is to provide useful information for water resources management at the watershed scale. MATERIALS AND METHODS Study area The Chehelchay River, one of the largest tributaries of the Gorganrood River, is located in Golestan province in the northeastern part of Iran. The river has a drainage area of about 25000 hectares which lies between longitude of 55°23´ and 55°38´ E and latitude of 36°59´ and 37°13´ N. The location of Chehelcay watershed is shown in Fig. 1. The watershed has an altitude range from 190 to 2570 m and a mean slope of 45.82 %. The underlying geology is mainly limestone formations, alluvial deposits near the streams and quaternary sedimentary formations,loess, in the lowlands of the study area. The climate of the region is mediterranean, which is warm and dry in summers, and temperate and rainy in winters. Average annual precipitation is about 750 mm, which mostly falls in winter and spring. Hence, the discharge into the river is relatively high during winter and spring, but low in summer and fall. Land use in the watershed is predominantly forest (55 %) and croplands (45 %). Data The data set of the Chehelchay water quality monitoring station was obtained from the Golestan Province Regional Water Agency that takes samples of surface water every month and analyzes the samples using standard methods. The selected parameters for the assessment of surface water quality characteristics were river discharge (Q), Electrical conductivity (EC), Total dissolved solids (TDS), pH, Total hardness (TH), sodium (Na+), potassium (K+), calcium (Ca2+), magnesium (Mg2+), chloride (Cl_), sulfate (SO42_) and bicarbonate (HCO3_ ). The water quality data available for the analysis in this study belongs to the observed period from 1995 to 2008. The main step before data analysis was the assessment of the quality of the data which was accomplished by calculating the ion balance error using Eq. 1 (Hounslow, 1995):
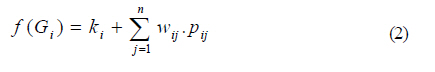
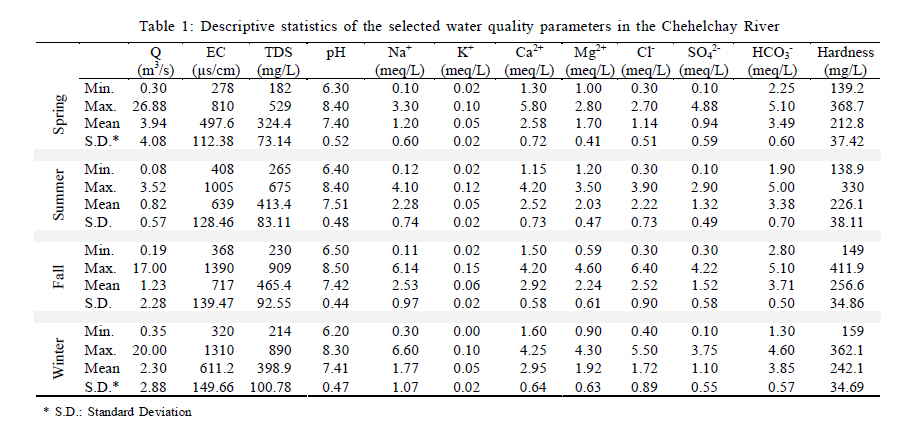
An error of up to ±5 % is tolerable, while the accuracy of the measurements with a calculated error outside this range is questionable (Hounslow, 1995). Approximately all of the water quality data for this study were within this range, so the data quality was acceptable for further analysis. To meet the purpose of this study, raw data were segregated into four seasonal groups of Spring (from March 21st. to June 21st.), Summer (from June 22nd. to September 22nd.), Fall (from September 23rd. to December 21st.) and Winter (from December 22nd. to March 20th.). Descriptive statistics of water quality parameters according to seasons are given in Table 1. Statistical analysis Seasonal variations of the water quality parameters were first evaluated through season-parameter correlation matrix, using the Spearman non-parametric correlation coefficient (Spearman R). To do this, a specific integer number was assigned to each season (winter = 1, spring = 2, summer = 3 and fall = 4). Then Spearman correlation was established between all of the water quality parameters and the ordinal variables (Wunderlin et al., 2001; Shrestha and Kazama, 2007). Multivariate statistical techniques including MANOVA, DA, PCA, and FA were then applied for the explanation of seasonal variations and interpretation of river water quality data set. All mathematical and statistical computations and graphical displays were made using R statistical package version 2.11.0. MANOVA and DA MANOVA performs an ANOVA style analysis on several dependent variables simultaneously. The objective of MANOVA is to investigate whether or not the combination of dependent variables varies with respect to the independent variables. The dependent variables are the predictors and the independent variables are the groups. The matrix of total variances and covariances; and the matrix of pooled within-group variances and covariances are compared via multivariate F tests in order to determine if there are any significant differences between groups, with regard to all variables (French et al., 2010). The second aaspect is prediction or allocation of observations to groups, in which Classification functions (CFs) are used to assign an observation to one of the groups (Rencher, 2002; Najafpour et al., 2008). The DA technique operates on original data and the method constructs a DF for each group, as in the Eq. 2 (Wunderlin et al., 2001; Shrestha and Kazama, 2007):
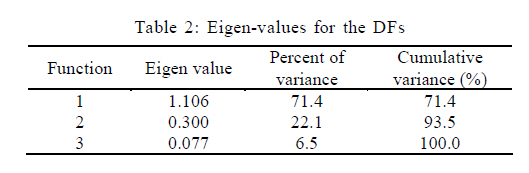
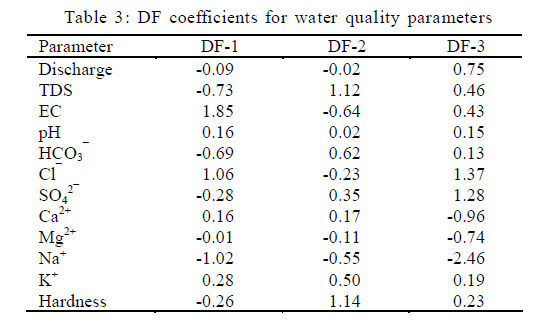
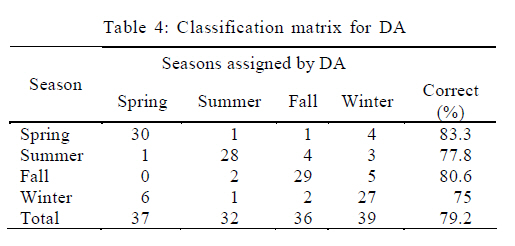
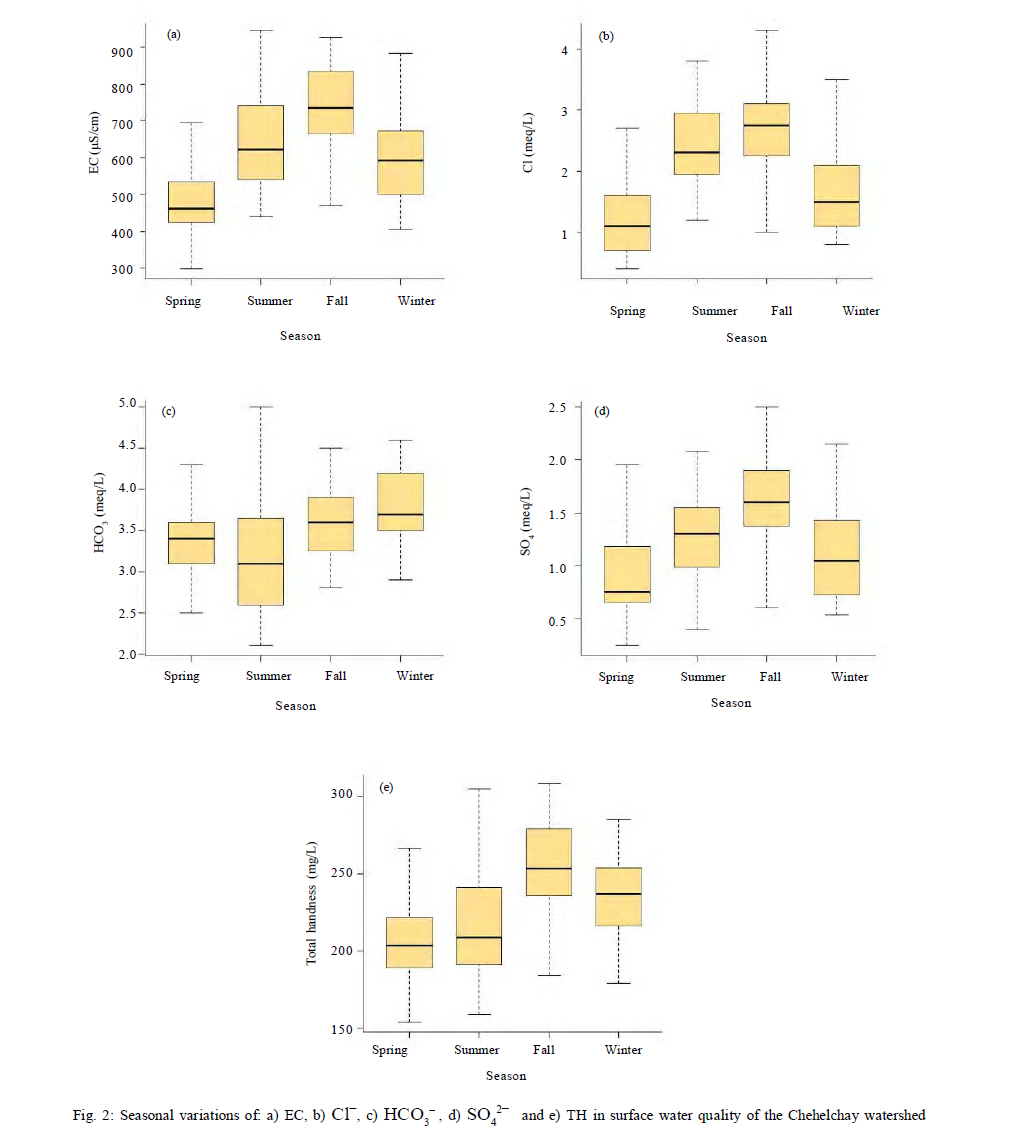
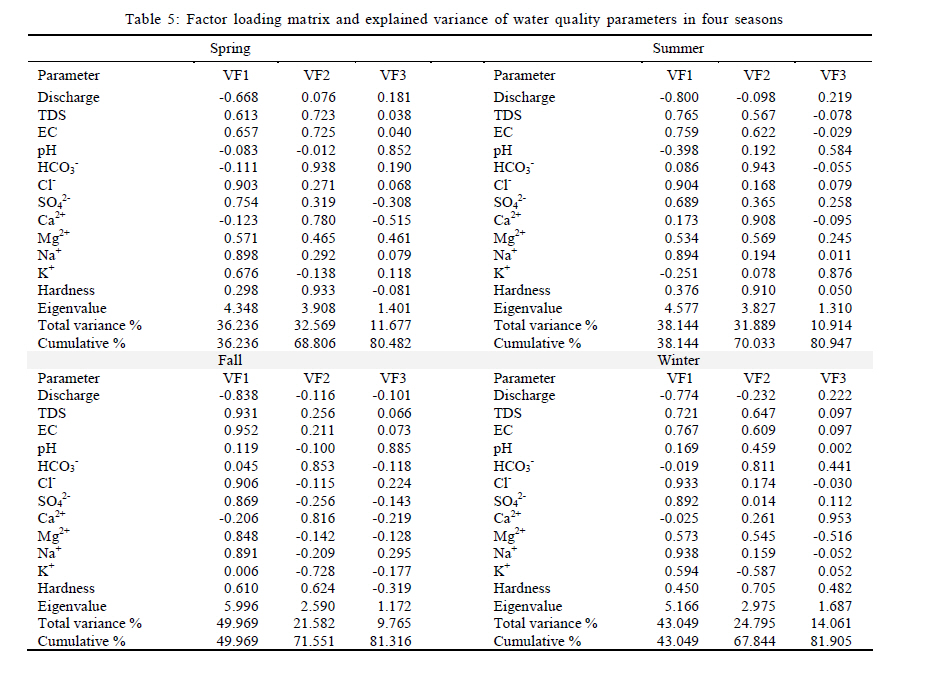
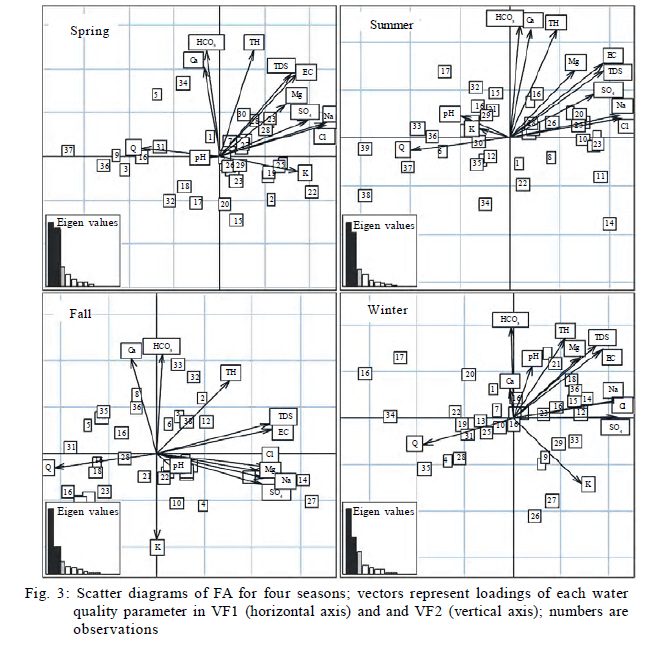
of parameters used to classify a set of data into a given group and wj is the weight coefficient, assigned by DA to a given selected parameters (pj). At the beginning, DA extracts a first function that will separate the groups as much as possible. It then chooses a second function that is both uncorrelated with the first function and provides as much further separation as possible. The procedure continues adding functions in this way until reaching the maximum number of functions as determined by the number of predictors and categories in the dependent variable (Wuensch, 2007). In DA, the seasons were considered as temporal grouping variables. These grouping variables were used in the analysis as dependent variables, while the water quality parameters were considered independent variables. DA was performed to determine the most significant water quality parameters associated with the differences between the seasons. The classification where i is the number of groups (G), ki is the constant inherent to each group, n is the number table, also called confusion matrix, was used to assess the performance of DA. Principal component analysis and factor analysis PCA is a statistical method used to determine components that are linear combinations of the original variables. In PCA, a set of p correlated variables is transformed to a smaller set of uncorrelated hypothetical constructs called principal components (PCs). For this purpose, a covariance matrix or correlation matrix is used. In PCA, the first PC, is the linear combination of the variables with maximal variance and represents the largest variability of the original data set. The second component is the linear combination with the next largest variability that is orthogonal to the first components and so on (Deb et al., 2008). Eq. 3 introduces the basic concept of PCA: Where Z is the component score, a is the component loading, x is the measured value of a variable, i is the component number, j is the sample number and m is the total number of variables. FA follows PCA. The main purpose of FA is to reduce the contribution of less significant variables to simplify even more of the data structure coming from PCA. This can be achieved by rotating the axis defined by PCA, according to well-established rules and constructing new variables, also called varifactors (Shrestha and Kazama, 2007). In mathematical terms, PCA and FA involve the following five major steps: 1) Start by coding the variables x1, x2… xp to have zero means and unit variances. Standardization of the measurements ensures that they all have equal weight in the analysis; 2) Calculate the covariance matrix; 3) Find the eigenvalues and corresponding eigenvectors; 4) Discard any components that only account for a small proportion of the variations in the dataset; and 5) Develop the factor loading matrix and perform a rotation on the factor loading matrix to infer the principal parameters (Ouyang et al., 2006). PCA and FA were performed on the water quality data for different seasons to discover the structure in the relationships between water quality parameters, in order to identify the important parameters which affect the chemistry of surface water in each season and to investigate the possible sources of different pollutants. RESULTS AND DISCUSSION Seasonal variations of river water quality Evaluation of seasonal variations in river water quality parameters through season-parameter correlation matrix showed that except pH, all other parameters are significantly (p < 0.01) correlated with season. Among these, chloride, river discharge, sodium and sulfate exhibited highest correlation as Spearman's R = 0.55, -0.54, 0.51and 0.44, respectively. Seasonality in various water quality parameters can be explained in terms of seasonal variations in climatologic and hydrologic characteristics associated with the wet (cold or temperate) and dry (warm) seasons. Looking for more evidences on seasonality, the data for water quality parameters were further analyzed by MANOVA and DA. The classical Wilks' Lambda statistic was used as a significance test for the equality of the group means in MANOVA (Nath and Pavur, 1985). According to the results (Wilks' lambda = 0.3141, p-value = 0.00) four seasons are significantly different with regard to all water quality parameters. DA was carried out to determine the most significant parameters associated with the differences between seasons. Three discriminant DFs were found, explaining 100 % of the total variance between seasons (Table 2). The first function explained 71.4 % of the total variance between seasons; the second function explained 22.1%, while the third one explained only 6.5 % of the total variance between the seasons. The relative contribution of each parameter is reported in Table 3. As it can be seen in Table 3, EC, Cl_ and Na+ have large absolute values in DF-1. These parameters have strong contribution in discriminating four seasons and account for most of the expected seasonal variations in water quality. The second group of parameters which have less contribution in explaining the seasonal variations are TDS, HCO3_ and TH in DF-1 and DF-2 and SO42_ and Ca2+ in DF-3. The classification matrix (Table 4) shows that 79.2 % of the cases are correctly assigned to their respective groups, indicating that the performance of DA has been quite good. After standard DA, backward stepwise variable selection technique using DA helped in finding the most important parameters. In this method, a model of discrimination is built including all variables and then variables are removed step-by-step, beginning with the less significant until no significant changes in removal criteria are obtained (Wunderlin et al., 2001; Shrestha and Kazama, 2007). The results suggest that EC, Cl_, HCO3_, SO42_ and TH are the most significant parameters. Stepwise, DA gave 70.2 % correct assignations using only the five discriminant parameters. Box and Whisker plots of the selected parameters showing seasonal trends are given in Fig. 2. The combined use of DA and Box and Whisker plots simplifies the interpretation of the results. As it can be seen in Fig. 2, higher values of EC, Cl_and SO42_ are observed in summer and fall and lower values in spring and winter. These parameters are reactive components that are partially of anthropogenic origin (Khazheeva et al., 2007). EC qualitatively reflects the status of inorganic pollution and is a measure of TDS in waters (McCutcheon et al., 1993). In the Chehelchay River, conductance values follow an inverse pattern with the river discharge, which shows the dilution effect. Average river discharge is higher in spring and winter as compared to summer and fall (Table 1). High EC values are observed as a result of decreased rainfall /discharge and increased agricultural land-use and built-up intensity in the river catchment. Of the dissolved solids, Cl_ is the easiest to account for because of its conservative nature and limited numbers of potential sources. The behavior of Cl_ is described as conservative because its circulation through the hydrological cycle is determined by physical rather than chemical processes (Grasby et al., 1997). High Cl_ concentrations in summer and fall indicate the hydrologic effect and anthropogenic pollution with NaCl, as observed in comparison with the Na+ concentrations (Table 1). Dissolved SO42_ can be derived from the dissolution of SO4 minerals; oxidation of pyrite and other forms of reduced S; oxidation of organic sulfides in natural soil processes; and anthropogenic inputs, i.e. fertilizers (Hem, 1985; Grasby et al., 1997). S-based fertilizers are not commonly used in the Chehelchay watershed and plausible origin of SO42_ in the river water is weathering of the sedimentary rocks. Seasonal variations of dissolved SO42_ could be attributed to changes in the intensity of weathering process. TH and HCO3_ concentration of the Chehelchay River water is high in Fall and Winter and low in Spring and Summer (Fig. 2c and e). These are nonreactive components that are determined by natural hydrogeochemical processes (Khazheeva et al., 2007). TH is dependent on the presence of Ca2+ and Mg2+ in water. Similar pattern in seasonal variation of TH and HCO3_ is possibly due to dissolution of minerals such as calcite and dolomite through HCO3_ weathering process. This process is represented by the following simplified reaction (Cai et al., 2007): CaCO3 + CO2 + H2 O <–> Ca2 + + 2HCO3 - (4) The reaction of HCO3_ minerals with dissolved carbon dioxide (carbonic acid) releases HCO3_ and Ca2+ in the river water. There is an inverse relationship between temperature and dissolved CO2 (Langmuir, 1997), thus the intensity of carbonate weathering and concentration of HCO3_ and TH is higher in cold seasons, i.e. Fall and Winter and lower in warm seasons. PCA and FA of water quality data PCA was performed on the normalized data sets containing 12 variables, separately for four different seasons, to compare the compositional pattern between water quality parameters and to identify the factors influencing them. PCA of the four data sets yielded three PCs with eigenvalues >1, explaining more than 80 % of the total variance in respective water quality data sets. An eigenvalue gives a measure of the significance of the PC; thus the PCs with the highest eigenvalues are the most significant. Eigenvalues of 1.0 or greater are considered significant (Shrestha and Kazama, 2007). For each season three varifactors (VFs) were obtained through the FA performed on the PCs. Results of FA including factor loadings, eigenvalues and total and cumulative variance values are presented in Table 5. Fig. 3 represents the results obtained for the first and second varifactors in different seasons. The factor loadings express the correlation between the original variables and the newly formed varifactors. The VF loadings can be used to determine the relative importance of a variable as compared to other variables in a factor and do not reflect the importance of the factor itself (Ouyang et al., 2006). Classification of factor loading is `strong', `moderate' and `weak', corresponding to absolute loading values of > 0.75, 0.75-0.50 and 0.50-0.30, respectively (Liu et al., 2003). Close inspection of eigenvalues, loadings and significant water quality parameters in each season reveals that beside geochemical aspects, seasonal regime of the Chehelchay River water quality is controlled by four important hydrologic/anthropogenic processes: 1) Dilution, during springtime, when river discharge reaches its maximum value; 2) Concentration, due to evapotranspiration and the base-flow effect, during the dry seasons, i.e. Summer and Fall; 3) Impact of non-point sources of pollution especially agricultural activities, that are dominant during the warm seasons and; 4) Flushing of soil-salts, due to floods occurring in Fall / Winter. Having the mentioned processes functioning over the watershed, relevant management policies and actions need to be implemented. To reduce the concentrations of chemical compositions of river water during the Summer, water extraction from the river for irrigation of rice paddies on floodplains of the main river should be regulated. Although the chemical fertilizers and pesticides effects have not been dealt with in this study, a large amount of chemical fertilizers and pesticides is applied on these paddies, which is finally released into the river ecosystem and deteriorates the river water quality. Moreover, plowing the steep slopes for dry farming throughout the watershed and application of chemical fertilizers and pesticides on these farms can cause non-point source pollution and flushing of soil-salts during the Fall and Winter, when the soil surface is rarely covered with vegetation or plant residues. It seems appropriate to apply the best management practices over the entire watershed to curb some of the environmental issues raised above. Of the best ways to mitigate the downgrading trend of river water quality, establishment of riparian vegetation is recommended. Obviously, a carefully planned sampling procedure is required to fill the current gap in available data in terms of sampling points distribution with regards to the geology and land use as well as including pathogens and fertilizers usage for the study area. CONCLUSION In this study, various multivariate statistical methods were utilized to evaluate seasonal variations in surface water quality of the Chehelchay watershed. The significance of the seasonal variations of water quality was evaluated by MANOVA. The results showed that the seasonal variations of the four seasons are significantly different. DA provided significant DFs and recognized the most significant parameters. It yielded a dramatic data reduction, as it used only five parameters (EC, Cl_, HCO3_, SO42_ and TH), leading to 70.2 % correct assignations of observations to respective season. The study shows that DA is the best data reduction and pattern recognition method for the study area in comparison to other techniques, that allows reduction in the dimensionality of the large data set, delineating a few indicator parameters responsible for large variations in water quality. PCA and FA assisted in extracting and recognizing factors or sources of origin responsible for water chemistry in four seasons of the year. PCA / FA identified three latent factors that explained more than 80 % of the total variance of 12 parameters, standing for salinity, carbonate weathering and alkalinity, respectively. Contribution of hydrologic processes and anthropogenic activities was also demonstrated by FA.The analytical results indicate that the surface water of the Chehelchay watershed is a unique example for the compound impact of weathering, hydrologic and anthropogenic processes. The chemical composition of surface water in each season is strongly influenced by rock-water interactions; dissolution and dilution; and anthropogenic inputs. This study demonstrates the usefulness of multivariate statistical techniques for analysis and interpretation of complex data sets, and also for identification of pollution sources and better understanding of seasonal variations in water quality for effective river water quality management. ACKNOWLEDGEMENTS The authors would like to thank the Gorgan University of Agricultural Sciences and Natural Resources for funding this study in the form of M.Sc. students financial support program (Grant No. 16-4983). REFERENCES
© IRSEN, CEERS, IAU The following images related to this document are available:Photo images[st11054f1.jpg] [st11054t4.jpg] [st11054f3.jpg] [st11054t5.jpg] [st11054f6.jpg] [st11054t1.jpg] [st11054f2.jpg] [st11054t3.jpg] [st11054t2.jpg] |
| |||||||||
