 |
| About Bioline | All Journals | Testimonials | Membership | News |
|
||||||
|
||||||
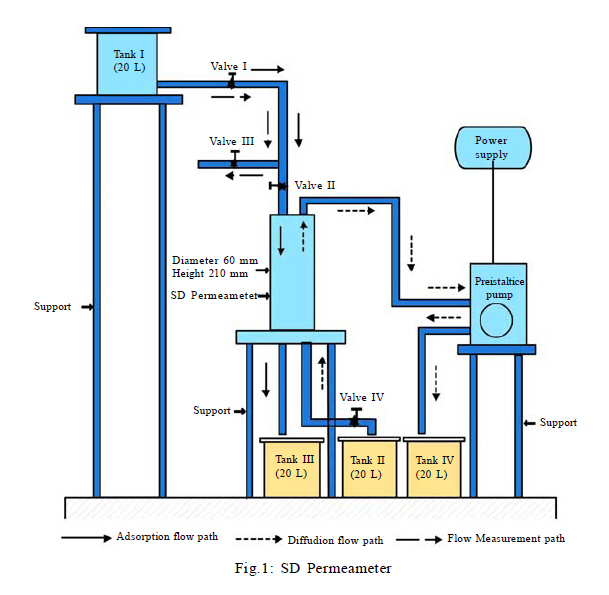
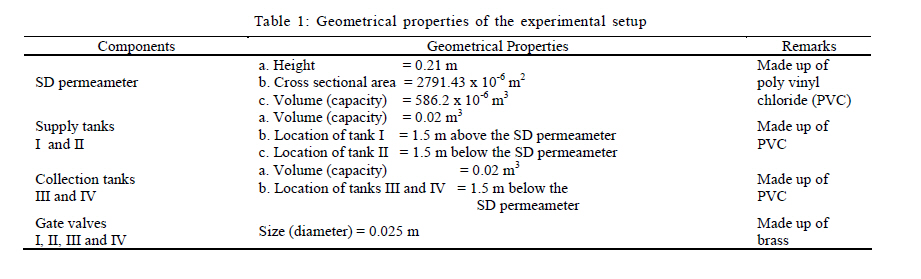
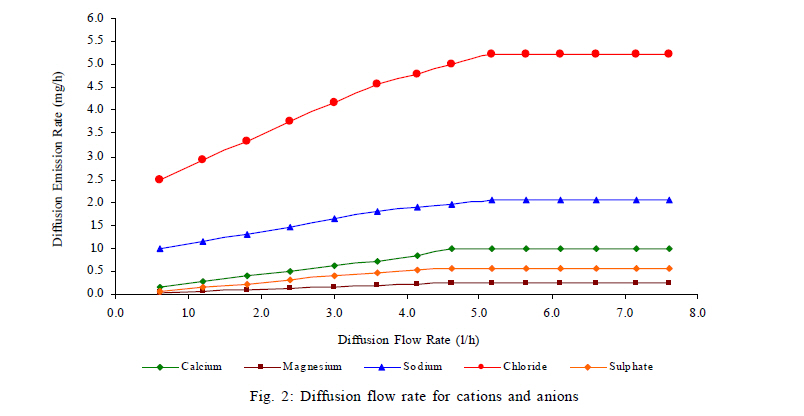
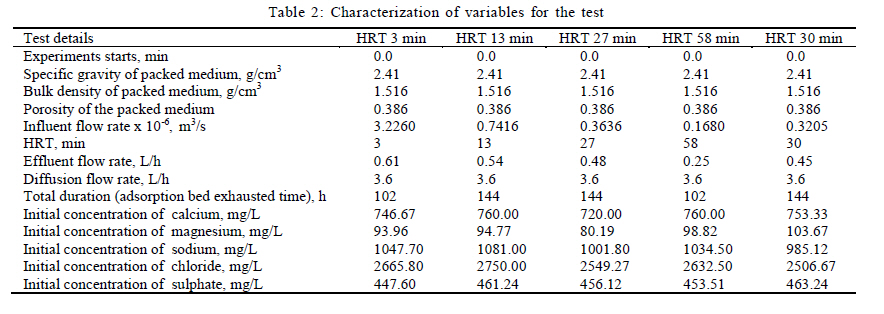
International Journal of Environment Science and Technology, Vol. 8, No. 3, 2011, pp. 593-604 A study on contaminant migration of sugarcane effluent through porous soil medium *D. Sivakumar Department of Civil Engineering, Easwari Engineering College, Anna University, Chennai 600 089, Tamil Nadu, India *Corresponding Author Email: shri_sivakumar@hotmail.com Tel./ Fax: +91-9790973774 Received 4 January 2011; revised 30 April 2011; accepted 15 May 2011 Code Number: st11055 ABSTRACT: A significantly large volume of effluent is generated during the manufacture of sugar and contains high amount of pollution load. The effluent from sugarcane industry is disposed off on land moves into the wider environment through a number of routes and the soil itself retains the various contaminants in the effluent to a greater or lesser extent depending on the physical nature of the soil. The analysis of contaminant transport through soil used to design of industrial wastewater treatments and disposal systems. This paper discussed the adsorption and diffusion of cations calcium, magnesium, sodium and anions chloride and sulphate by the sorption diffusion permeameter under different hydraulic retentions time of 3 min, 13 min, 27 min and 58 min with a constant diffusion flow rate of 3.6 L/h. In this study, less percentage error found between observed adsorption and diffusion coefficients from the experiments at different hydraulic retentions time and optimum adsorption and diffusion coefficients from the experiments at optimum hydraulic retentions time of 30 min for calcium, magnesium, sodium, choloride and sulphate. The results of regression analysis implied that the adsorption and diffusion coefficients obtained from the equation for cations and anions were good recognizing with the experimental results. Keywords: Anions; Cations; Permeameter; Regression INTRODUCTION In India, sugarcane industry is highly responsible for creating significant impact on rural economy after textiles (Trivedy, 1998). The manufacture of sugar does not essentially produce any pollution, however due to improper house keeping and defects in manufacturing units, it contributes a lot to increase of pollution load, particularly in terms of suspended solids, organic matter, pressed mud, baggase, molasses and spent-wash (Trivedy, 1998; Hanumantha Rao, 2002; Le Man et al., 2010). Of all above said pollutants, the recognized high concentrated pollutant produced by sugarcane industry, both in magnitude and strength is spent-wash or effluent. An impact of effluent from sugarcane industry, particularly on soil environment is most significant. (Sivakumar and Swaminathan, 2002). Generally, effluent generated from sugarcane industry is disposed off on land. While moving on land, part of pollutants in the effluent may be migrated and deposited between the gaps of soil stratum and adsorbed on the soil particles surface, resulting in pollution of soil. Furthermore, the migrated effluent flows through the gaps in the soil stratum and reaches the groundwater table, which may cause impact to the aquifer and thereby pose a potential risk to human health as well as the surrounding environment (Grisak and Pickens, 1980; Rowe and Booker, 1985a; b; Sangam and Rowe, 2001; Sheikh et al., 2009). Thus, prior to any quantification of contaminants transport through the gaps in the soil stratum, one must establish values for the parameters that controll the transport mechanism (Sudicky and Frind, 1982; Mahler and Velloso, 2001; Nouri et al., 2009; 2011). Most of the previous studies revealed that the controlling parameters are diffusion and adsorption coefficients (Crooks and Quigley, 1984; Fityus et al., 1999; Malakootian et al., 2009). The diffusion coefficient represents the molecules transport in solute and diffusion through the solid or liquid phase (Rowe and Booker, 1988; Rowe, et al., 1988; Liu et al., 2004; 2007; Okoye et al., 2010).The adsorption coefficient represents the adsorption interactions between the solute and the solid phase (Barone et al., 1989; Kim et al., 2003; Mohammed et al., 2008). However, some studies proved that advection, dispersion, precipitation, hydrolysis, oxidation and decay (Sudheer et al., 2008; Thakre et al., 2009; Dilip et al., 2011) processes controlled the transport of contaminants through porous soil medium. The evaluation of contaminant transport from effluent disposal sites and the potential for groundwater contamination in fractured / porous medium, requires consideration of advective-dispersive transport (Sudicky and Frind 1982; Rowe and Booker, 1989; Fityus et al., 1999; Neretnieks, 2002) along the fractures or pores and diffusive transport (Barone et al., 1990a; Shackelford, 1991; Liu et al., 2002) from the fractures or pores into the surrounding porous matrix. Linear sorption and diffusion processes govern a common approach to the simulation of transport of contaminants in porous medium. Many researchers conducted the sorption and diffusion studies using column experimental setup (Jessberger and Onnich, 1994; Liu et al., 2004; Zang et al., 2006). However, studies have revealed that the transport of many contaminants in porous medium is sensitive to sorption isotherm non-linearities rather than on kinetic sorption relationships because of their computational simplicity (Sangam and Rowe, 2001; Kalbe et al., 2002). Both linear and non-linear are a functional expression for the variation of adsorption with concentration of adsorbate in bulk solution at constant temperature (Hoffman and Rolston, 1980). Therefore, there is a need for understanding pollution load as a first step, with the help of sorption and diffusion study. This paper mainly dealt with sorption and diffusion of cations calcium (Ca2+), magnesium (Mg2+), sodium (Na+) and anions choloride (Cl-) and sulphate (SO42-) present in the effluent of sugarcane industry by soil medium using Sorptiond iffusion (SD) permeameter. The SD permeameter constructed in the Environmental Engineering Laboratory, Department of Civil Engineering, National Institute of Technology, Trichirappalli, Tamil Nadu, India and the experiments carried out in March of 2004. The advantage of SD permeameter was that the soil bed of the SD permeameter achieved the simultaneous sorption and diffusion processes of various pollutants in the contaminant solution. MATERIALS AND METHODS Assumptions The assumptions made for this present investigation are: 1) Concentration of solution (contaminant) passing through the soil sample (adsorbent) was assumed to be a constant throughout the experiments; 2) All joints or fittings, valves, flow system, flow rates of solution (contaminant) and flow rates of solvent (deionized water) were perfect, i.e., nearly zero per cent leakage; 3) Particle size and density of soil sample in the SD permeameter was assumed to be constant. Study area The study area for this present investigation was in Kurungulam village, Thanjavur District, Tamil Nadu, India. The normal soil existing in Kurungulam village was clay loam. The climate was of tropical type with dry summer extending from March to June. The temperature of 36.2 °C and 23.6 °C observed as average maximum and minimum temperature respectively for the study area. Collection of soil and effluent samples This study used the soil samples collected from Kurungulam village, Thanjavur District, Tamil Nadu, India, where a sugarcane industry discharges effluent in the nearby vicinity. Auger and borehole used to collect the soil samples. Furthermore, clean polythene bags used to preserve the soil samples, labeled and then taken to laboratory. Three samples were collected from each station and these were then mixed together to obtain a composite representative sample. Soil samples passed through a 2 mm screen (to remove the larger particles) were air-dried (Srinivas and Suresh Kumar, 2001). Finally, the SD permeameter packed by the composite representative soil. In addition, this study used the effluent collected from sugarcane industry, which was located in Kurungulam village. Clean plastic containers used for collecting the effluent samples from sugarcane industry, then, taken to the laboratory and stored at 4 °C. As similar to soil samples collection, three effluent samples collected from each station and these were then mixed together to obtain a composite representative sample. The cations Ca2+, Mg2+ and Na+ and anions Cl- and SO42- in the effluent were analyzed in the laboratory, before and after passing through the SD permeameter (APHA et al., 1998). Experimental setup The detailed experimental setup (SD permeameter) for the adsorption and diffusion of cations and anions in the effluent through the porous soil medium is shown in Fig.1. The experimental setup consists of: 1) SD permeameter: It is a circular tank filled with virgin soil obtained from the Kurungulam village such that whose bulk density is equal to 1516 kg/m3. The top of the SD permeameter connected the tank I and tank IV, and bottom of the SD permeameter connected the tank II and tank III respectively. The SD permeameter is fully air tightened. 2) Source solution tank I and tank II: The contaminant solution and deionized solution is filled in Tank I and Tank II, respectively. The Tank I is located 1.5 m above and Tank II is located 1.5 m below the SD permeameter. The flow of contaminant solution from the Tank I to the SD permeameter is gravitational flow. By opening the valves 1 and 2 and by closing the valve 3 are used to control the flow. Peristaltic pump and valve 4 are controlling the flow of deionized solution from the Tank II to the SD permeameter. The outlet (valves 1 and 4) from these two tanks (Tank I and Tank II) is supplied the source solution (contaminant solution from the Tank I and solvent usually deionized water from the Tank II) to the SD permeameter. 3) Receptor tank III and tank IV: The effluent from the SD permeameter in the direction of flow (after adsorption process is over) collected from the tank III and the effluent from the SD permeameter in upward flow (after diffusion process is over) is collected from the tank IV. 4) Peristaltic pump: It is a pump used to control and measure the flow rate of solvent (deionized water) from the tank II to tank IV. 5) Valves: There are 4 valves such that valves 1 and 2 are used to control the flow rate of contaminant solution from the tank I and valve 3 is used to control the flow rate of deionized water along with peristaltic pump, however the valve 4 is used to measure the flow rate of contaminant solution (by opening valves 1 and 4 and by closing valve 2) and peristaltic pump is used to measure the flow rate deionized water from the tank II. The SD permeameter used a counter current type of flow. The SD permeameter allowed the effluent from the tank I, which flows through by virtue of gravity and get collected in tank III. The deionized water from the tank II flows in a counter current way by means of a suction Peristaltic pump and get collected in tank IV. The geometrical properties of the experimental setup are given in Table 1. Test details The SD permeameter (Fig.1) conducted the experiments at four different Hydraulic retention times (HRTs) with a constant diffusion flow rate of 3.6 L/h (Fig.2) and an optimum HRT was arrived based on the input-output characteristics of the effluent A separate experiment conducted for cations and anions used to select the constant diffusion flow rate (Fig.2). The experiments conducted using the effluent from sugarcane industry. Fig. 2 indicated that upto flow rate 3.6 L/h, the diffusion emission rate of cations Ca2+, Mg2+ and Na+, and anions Cl- and SO42- were linear and the point of inflection appeared above this range. This inflection point was chosen as an optimum point. It should be noted that all the tests involve similar soil, similar cell geometry and same flow rate of solvent (deionized water) but varying flow rate of source solution. Thus, any differences in migration observed would be due to variation in physical and chemical interaction between solution, solute and porous medium that influences the adsorption and diffusion processes in the adsorption bed (Quigley et al., 1987; Barone et al., 1990b). The time at which all the tests were terminated was selected based on the adsorption bed exhausted time. Table 2 indicates the characterization of the variables used for all tests. After moulding the SD permeameter by the soil, the experiments started immediately. Theoretical development Adsorption is the process by which various contaminants present in the source solution attach themselves to the surfaces of solids (Elangovan and Saseetharan, 1997). The quantity of adsorbate that can be taken up by an adsorbent is a function of both the characteristics and concentration of adsorbate (Kookana et al., 1992; Lake and Rowe, 2000). In the adsorption column study (SD permeameter), the relationship between amount of solute adsorbed per unit weight of solid adsorbent and the equilibrium concentration of constituents in the liquid is found to be linear. Mathematically, the relationship may be expressed as a modified Freundlich adsorption isotherm (Metcalf and Eddy, 1995). According to Freundlich adsorption isotherm (Kookana et al., 1992; Elangovan and Saseetharan, 1997), the adsorption of any contaminants in a porous medium is expressed as:
In which,
adsorption coefficient or distribution coefficient, [L3/M], Ce is the equilibrium concentration in liquid [ML3] and N is the adsorption intensity factor or non-linearity factor. For the case of linear sorption, the adsorption intensity factor or non-linearity factor (N) is one and it is substituted in equation.1, becomes: The Eq. 2 is called modified Freundlich
adsorption isotherm and the logarithmic plot
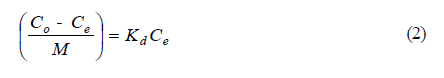
between the
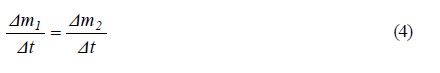
In which, C is the contaminant concentration in solution phase [M/L], `t' is the time [T], Z is the total height of the sample [L] and D is porous medium diffusion coefficient [L2 /T]. The diffusion coefficient is obtained when the test reaches the stationary phase where the diffusion emission rate is constant for all parameters. In the stationary phase:
In which,
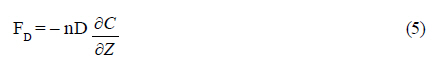
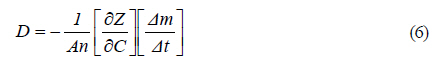
In which, FD is the flow of mass [M/L2T] due to molecular diffusion is equal to product of mass density of contaminant and velocity of flow of solution through the soil sample, `n' is the soil porosity [M0L0T0] and D is the coefficient of effective diffusion [M/T2]. The solution for the Eq. 5 is given by (Mahler and Velloso, 2001):
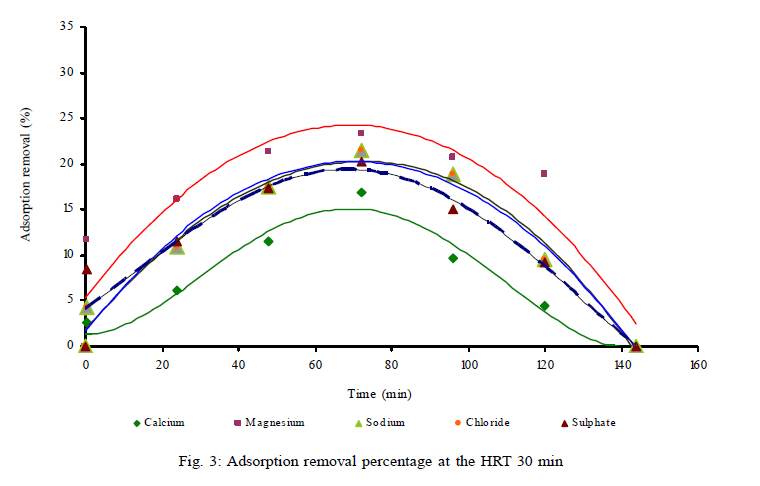
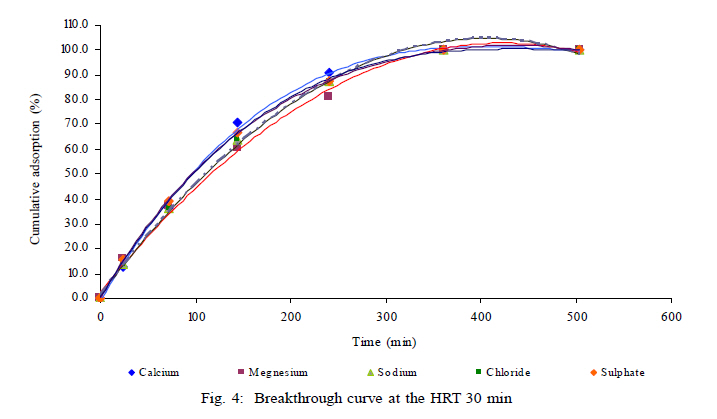
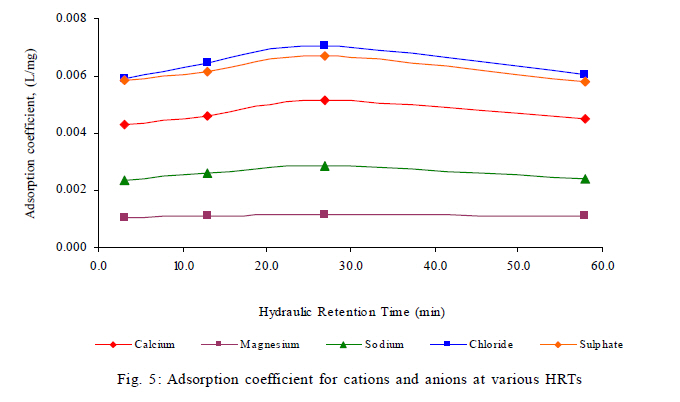
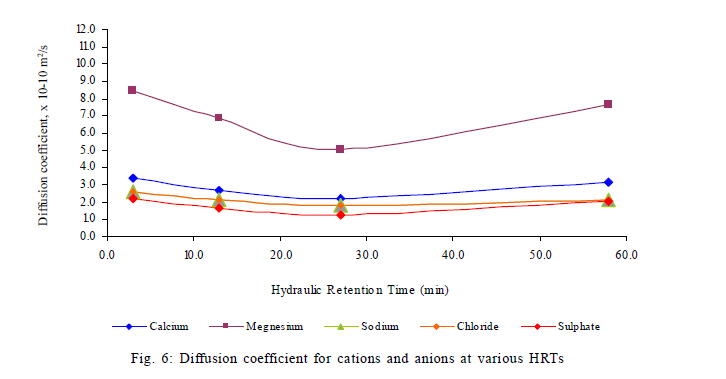
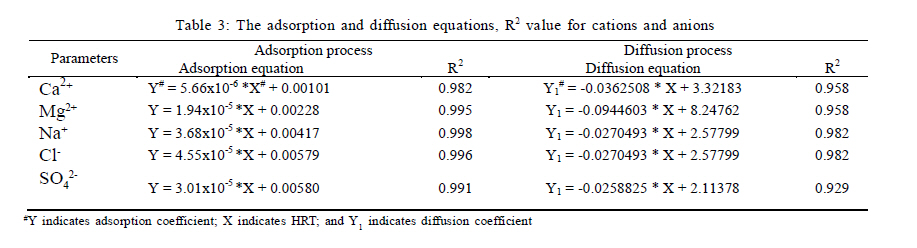
In which, A is cross sectional area of the SD permeameter [L2]. In this study, Eq .6 is used to calculate the diffusion coefficient for various contaminants present in the solution by keeping other geometrical parameters like flow velocity of solvent (deionized water), bulk density of soil sample and porosity of soil sample as constant. The adsorption and diffusion coefficients for this study are different from the previous studies (Rowe and Booker, 1988; Barone et al., 1989; Mahler and Velloso, 2001), since they are calculated when simultaneous sorption and diffusion processes of various pollutants occurred in the SD permeameter. RESULTS AND DISCUSSION The efficiency of the adsorption process generally depends on the surface area of the adsorbent; attractive forces of the atoms and molecules of various parameters in the contaminant solution; and the chemical reaction between the adsorbate molecules and the adsorbent (McGechan and Lewis, 2002). In this study, the adsorption and diffusion experiments were conducted using SD permeameter (Fig.1) for cations Ca2+, Mg2+ and Na+ and anions Cl- and SO42- in which flow rates were well controlled (Liu et al., 2004; Zang et al., 2006). The adsorption study using SD permeameter revealed that the maximum adsorption removal percentage for Ca2+ at HRT 3 min, 13 min, 27 min and 58 min was 12.50 %, 13.16 %, 14.81 % and 10.09 %, respectively. The maximum adsorption removal percentage for Mg2+ at HRT 3 min, 13 min, 27 min and 58 min was 21.03 %, 28.20 %, 29.29 % and 21.31 %, respectively. The maximum adsorption removal percentage for Na+ at HRT 3 min, 13 min, 27 min and 58 min was 17.47 %, 20.05 %, 24.24 % and 17.65 %, respectively. Furthermore, adsorption study found that the maximum adsorption removal percentage for Cl- at HRT 3 min, 13 min, 27 min and 58 min was repectively the same as that of adsorption removal percentage of Na+. The maximum adsorption removal percentage for SO42- at HRT 3 min, 13 min, 27 min and 58 min was 15.62 %, 16.41 %, 17.98 % and 15.47 %, respectively. In the adsorption study, for a period of 35 to 45 min, the source solution (effluent from sugarcane industry) was in contact with fresh adsorbent at the top of the soil bed in the SD permeameter. The soil bed of SD permeameter adsorbed the various parameters like Ca2+, Mg2+, Na+, Cl- and SO42- from the source solution as it flows down. As a result, lesser adsorption percentage observed in the length of region where most of the solute was removed called Adsorption zone (AZ) or Mass transfer zone (MTZ). Breakthrough curves matched the values for effective transport coefficients (adsorption and diffusion) (Liu et al., 2007) from column experiments (SD permeameter) with an analytical solution (Eqs .2 and 6). Breakthrough curves for Ca2+, Mg2+ and Na+ at different HRTs revealed that the total adsorbed Ca2+ at HRT 3 min, 13 min, 27 min and 58 min in the soil column respectively was 2938.70 mg (6.30 %), 3890.34 mg (6.57 %), 4070.15 mg (7.98 %) and 1183.25 mg (6.05 %). The total adsorbed Mg2+ at HRT 3 min, 13 min, 27 min and 58 min in the soil column was respectively 799.27 mg (13.66 %), 1039.55 mg (14.09 %), 903.32 mg (16.25 %) and 331.17 mg (13.02 %). Moreover, the total adsorbed Na+ at HRT 3 min, 13 min, 27 min and 58 min in the soil column was 6322.24 mg (9.69 %), 9512.60 mg (11.29 %), 9795.60 mg (12.55 %) and 2826.10 mg (10.61 %) respectively. In addition, breakthrough curve for Cl- and SO42- at different HRTs revealed that the total adsorbed Cl- at HRT 3 min, 13 min, 27 min and 58 min respectively in the soil column was 16085.80 mg (9.69 %), 24163.40 mg (11.29 %), 24935.60 mg (12.55 %) and 7195.17 mg (10.61 %). The total adsorbed SO42- at HRT 3 min, 13 min, 27 min and 58 min respectively in the soil column was 2733.92 mg (9.81 %), 3608.26 mg (10.05 %), 4090.06 mg (11.94 %) and 976.13 mg (8.36 %). It may be noted from the cations adsorption by SD permeameter that magnesium was adsorbed higher by the soil bed in the SD permeameter followed by the Na+and Ca2+ respectively. The adsorption of Ca2+, Mg2+ and Na+ by the soil bed may be of both physical and chemical adsorption processes. Besides, it may found from anions adsorption by SD permeameter that Cl- adsorbed higher by the soil bed in the SD permeameter followed by SO42-. The attractive forces of sodium with clay particles in the SD permeameter would be higher, results more adsorption removal percentage by the soil bed in the SD permeameter. This study indicated that after 35 min to 60 min for all HRTs, from the commencement of the experiment, the adsorption started and exhaustive capacity of the soil column ended with 102 h for the HRT of 3 min and 58 min, and 144 h for the HRT of 13 min and 27 min, respectively. This study also indicated that the total amount of Ca2+, Mg2+, Na+, Cl- and SO42- adsorbed by the soil bed appeared to be significantly higher for the HRT of 13 min and 27 min than for the HRT of 3 min and 58 min. The lower adsorption observed for the HRT of 3 min might be because, there was no contact time between various parameters in the contaminant solution with the soil surface, i.e., the incoming contaminant solution moves through the gap between the soil particles than the pores on the soil particles. Lower the adsorption observed for the HRT of 58 min was due to large contact time between the various parameters in the contaminant solution (source solution) with the top of the soil bed in the SD permeameter than the bottom of the soil bed in the SD permeameter. As a result, there was insignificant movement of MTZ below the top of soil bed in the SD permeameter, i.e., the adsorption process utilized the top of the soil bed. For the HRT of 13 min and 27 min, the entire bed utilized moderately for the adsorption of various parameters in the contaminant solution, i.e., there was significant movement of MTZ for the entire soil bed in the SD permeameter. As a result, higher the adsorption observed for the HRT of 13 min and 27 min. Modified Freundlich isotherm (Eq. 2) fitted the adsorption equilibrium data for this study. The results of modified Freundlich isotherm indicated that the adsorption capacity of cations Ca2+, Mg2+ and Na+ and anions Cl- and SO42- increased with the increased HRT. Furthermore, an optimum HRT, for which, the maximum adsorption removal percentage was found to be 30 min, which was found to occur between the HRT of 27 min and 58 min. Thus, the HRT of 30 min used for checking the repeatability and validity of the experiments. Fig. 3 shows the adsorption removal percentage for Ca2+, Mg2+, Na+, Cl- and SO42- at the HRT of 30 min. Fig.4 shows the adsorption breakthrough curve for Ca2+, Mg2+, Na+, Cl- and SO42- at the HRT of 30 min. From Fig.3, it may be found that maximum adsorption removal percentage was 16.81 %, 23.36 %, 21.53 %, 24.53 % and 20.25 % for Ca2+, Mg2+, Na+, Cl- and SO42-respectively. From Fig.4, it may be found that the total adsorbed Ca2+, Mg2+, Na+, Cl- and SO42- at the HRT of 30 min was 3961.67 mg (8.1 %), 1343.95 mg (16.75 %), 8356.81 mg (13.07 %), 21264.10 mg (13.07 %) and 3675.74 mg (12.23 %), respectively. The maximum adsorption removal percentage, the total mass adsorption and adsorption coefficient for cations and anions obtained from Figs.3 and 4 (HRT 30 min) were well fitted with the maximum adsorption removal percentage, total mass adsorption and adsorption coefficient for cations and anions obtained between the HRT of 27 min and 58 min. Figs.5 and 6 show the adsorption coefficient (obtained from Eq.2) and diffusion coefficient (obtained from Eq. 6) respectively for cations like Ca2+, Mg2+ and Na+ and for anions like Cl- and SO42- at different HRTs. From Fig. 5, it may be inferred that adsorption coefficient (Kd) for Ca2+ ion was found to be higher than the other cations. The chronological sequence was found as Na+ and Mg2+. In case of anions the order was Cl- ion followed by SO42-. The value of adsorption coefficient varied from 0.00430 to 0.00515 L/mg for Ca2+, from 0.00105 to 0.00115 L/mg for Mg2+ and from 0.00235 to 0.00285 L/mg for Na+ (Fig. 5). Similarly, Kd varied from 0.00590 to 0.00705 L/mg for Cl-and from 0.00585 to 0.00690 L/mg for SO42- (Fig. 5). From Fig. 6, it may be inferred that maximum diffusion coefficient (D) was observed for Mg2+ ion followed by Ca2+ and Na+ of cations. Similarly, maximum D was observed for Cl- ion followed by SO42-. The value of D varied from 2.18 x 10⁻¹⁰ to 3.42 x 10⁻¹⁰ m2 /s for Ca2+, from 5.08 x 10⁻¹⁰ to 8.41 x 10⁻¹⁰ m2 /s for Mg2+, from 1.79 x 10⁻¹⁰ to 2.60 x 10⁻¹⁰ m2 /s for Na+, from 1.79 x 10⁻¹⁰ to 2.60 x 10⁻¹⁰ m2 /s for Cl- and from 1.23 x 10⁻¹⁰ to 2.22 x 10⁻¹⁰m2 /s for SO42- (Fig. 6). At low HRT, the flow velocity of contaminant solution (source solution) from the source tank I to the SD permeameter was higher, which could have been cause for the parameters like Ca2+, Mg2+, Na+, Cl- and SO42- present in the contaminant solution, not been held by the gaps between the soil particles in the SD permeameter.In addition, one more observation had been identified that when the velocity of flow of solvent (deionized water) increased than the incoming velocity of flow of contaminant solution, the diffusion process was started. The increased velocity of solvent was sufficient to remove the small amount of contaminants (cations and anions) in the gaps of soil particles in the SD permeameter. Thus, at low HRT, the adsorption in the soil sample was lesser and the diffusion in the soil sample was higher, which lead to have lesser adsorption coefficient and higher diffusion coefficient. In contrast, for higher HRT, the flow velocity of contaminant solution from the source tank I was lesser and it allowed the various parameters like Ca2+, Mg2+, Na+, Cl- and SO42- present in the contaminant solution to be held in the pores of the soil particles and the gaps between the soil particles in the SD permeameter. Furthermore, insufficient flow velocity of solvent from the source tank II to SD permeameter was not carrying all cations and anions in the pores of the soil particles and the gaps between the soil particles in the SD permeameter. Thus, at higher HRT, adsorption was higher and diffusion was lesser, which lead to have higher adsorption coefficient and lesser diffusion coefficient. The optimum adsorption coefficient for Ca2+, Mg2, Na+, Cl- and SO42- obtained from Fig. 5 (different HRTs) was 0.00526 L/mg, 0.00118 Lmg, 0.00290 Lm/g, 0.00719 L/mg and 0.00671 L/mg respectively. Similarly, adsorption coefficient for Ca2+, Mg2+, Na+, Cl- and SO42- at an optimum HRT of 30 min was 0.00540 L/mg, 0.00120 L/mg, 0.00295 L/mg, 0.00735 L/mg and 0.00680 L/mg respectively. Thus, the percentage error for the adsorption coefficient between observed and optimum results for Ca2+, Mg2+, Na+, Cl- and SO42- was 2.59 %, 1.67 %, 1.69 %, 2.17 % and 1.32 % respectively. The optimum diffusion coefficient for Ca2+, Mg2+, Na+, Cl- and SO42- obtained from Fig. 6 (different HRTs) was 2.1 x 10⁻¹⁰ m2 /s, 5.01 x 10⁻¹⁰ m2/s, 1.75 x 10⁻¹⁰ m2/s, 1.75 x 10⁻¹⁰ m2/s and 1.2 x 10⁻¹⁰ m2/s respectively. Similarly, diffusion coefficient for cations Ca2+, Mg2+ and Na+ and for anions Cl- and SO42- at an optimum HRT of 30 min was 2.16 x 10⁻¹⁰ m2/s, 5.1 x 10⁻¹⁰ m2/s, 1.78 x 10⁻¹⁰ m2/s, 1.78 x 10⁻¹⁰ m2/s and 1.26 x 10⁻¹⁰ m2/s respectively. Thus, the percentage error for the diffusion coefficient between observed and optimum results for Ca2+, Mg2+, Na+, Cl- and SO42- was 2.77 %, 1.76 %, 1.68 %, 1.68 % and 4.76 % respectively. The regression analysis performed the degree of relationship between two or more variables for all parameters for this present study.Based on the regression analysis, a simple equation can be written for the adsorption and diffusion coefficients of Ca2+, Mg2+, Na+, Cl- and SO42- (Figs. 5 and 6). The adsorption and diffusion equations, R2 value for cations and anions are given in Table 3. The results of regression analysis (Table 3) showed that the adsorption and diffusion coefficients obtained from equation for cations and anions were good recognizing with the experimental results. The obtained optimum adsorption and diffusion coefficients for the parameters Ca2+, Mg2+, Na+, Cl- and SO42- of this study have been verified with results of earlier investigators. Barone et al. (1989) have described laboratory model tests involving the placement of landfill leachate on top of a layer of saturated undisturbed clayey soil and allowing chemical constituents to migrate into the soil by diffusion only. The experimental diffusion coefficient were determined for the various chemical constituents like Cl-, Na+ and K+ to be 7.5 x 10⁻⁶, 4.6 x 10⁻⁶ and 6.0 x 10⁻⁶ cm2/s, respectively and corresponding adsorption in terms of rCl-, rNa+ and rK+ to be 0, 0.25 and 1.7 respectively. Barone et al. (1990a) have conducted an experimental investigation for diffusive transport of a nonreactive chloride in saturated, intact Queenston Shale. Fick's diffusion theory used to deduce the diffusion coefficient. The experimental diffusion coefficient for chloride ranged from 1.4 x 10⁻⁶ to 1.6 x 10⁻⁶ cm2/s, which corresponds to a tortuosity ranging from 0.095 to 0.108. Further, Barone et al. (1990b) have conducted the experiments for determination of Cl- diffusion coefficient in saturated intact Bison mudstone. The diffusion coefficient for chloride ranged from 1.5 x 10⁻⁶ to 2.0 x 10⁻⁶ cm2/s from which, calculated the corresponding tortuosity factor ranging from 0.15 to 0.20. Lake and Rowe (2000) have conducted two different diffusion experiments for finding the diffusion coefficient for Na+ and Cl- through geosynthetic clay liners (GCL). The diffusion coefficient for Cl- may be varied from 1.5 x 10⁻¹⁰m2/s to 3.7 x10⁻¹⁰ m2/s and Na+ diffusion coefficient may be varied from 1.1 x 10⁻¹⁰ m2/s to 6.0 x 10⁻¹⁰ m2/s and final bulk GCL void ratio varied from 1.1 to 3.6 and porosity varied from 0.56 to 0.83. Mahler and Velloso (2001) have analysed the contaminant transport through the clay liner by using DKS (diffusion, convection, and sorption) permeameter. The effective diffusion coefficient obtained from the emission factor in the stationary phase of experiments and the adsorption obtained from the calculated accumulated mass over the time of the experiments. The diffusion coefficient and adsorption coefficients obtained from the DKS permeameter depend on the input concentration, soil structure and texture. The diffusion coefficient for chlorine varied from 7.9 x 10⁻¹⁰ m2/s to 8.5 x 10⁻¹⁰ m2/s and for potassium varied from 7.5 x 10⁻¹⁰ m2/s to 8.5 x 10⁻¹⁰ m2/s. Based on the less percentage error found between observed adsorption and diffusion coefficients from the experiments at different HRTs and optimum values obtained from the experiments at optimum HRT of 30 min, the results of R2 value from the regression analysis and the comparison made between the present study with the previous studies for adsorption and diffusion coefficients, the present study concluded that it is very useful for predicting the adsorption and diffusion coefficients by the soil bed. CONCLUSION With increasing discharge of spent-wash on land, groundwater is exposed to the risks of contamination requires remedial measures. Thus, the analysis of contaminant transport through soil medium used to design the industrial effluent treatment and disposal systems and it requires an estimate of potential contaminant transport rate. The following conclusions made from this study were: 1) From the adsorption experiment, it was found that the maximum Kd observed for Ca2+ followed by Na+ and Mg2+ of cations and the maximum Kd observed for Cl- followed by SO42- of anions. Furthermore, from the diffusion experiment, it was found that the maximum D observed for Mg2+ ion followed by Ca2+ and Na+ of cations. Similarly, the maximum D observed for Cl- ion followed by SO42- of anions. 2) The adsorption and diffusion capacities were strongly dependent on the flow rate of source solution, flow rate of solvent, concentration of cations and anions, MTZ in the soil bed, hydraulic retentions time, and the knowledge of adsorption isotherms for all ions (cations and anions) over a wide range of HRTs. 3) The cations originally dominant on the clay exchange sites were reacted with anions in the source solution and the anions originally dominant on the clay exchange sites were reacted with cations in the source solution, result, varying in the adsorption and diffusion coefficients in the soil bed. Similarly, the difference in Kd and D values obtained for the effluent from the sugarcane industry were believed to be associated to the nature of electro-chemical interaction between cations and anions with the exchangeable clay sites. 4) The maximum adsorption removal percentage, the total mass adsorption and adsorption coefficient for all parameters obtained from the HRT of 30 min were well fitted with the maximum adsorption removal percentage, total mass adsorption and adsorption coefficient for all parameters obtained at different HRTs. 5) The results obtained from the regression analysis for the adsorption and diffusion coefficients by the soil bed were good recognizing with experimental results. 6) The knowledge about exchangeable sites in the soil bed and the adsorption and diffusion process of various contaminants through the soil bed provided the solution to know how the various contaminants attenuated naturally. Furthermore, the adsorption and diffusion coefficients used in the design of any collection system to avoid or reduce the migration of contaminants, in any type of effluent discharge, on the soil bed. Acknowledgements The author is indebted to Prof. K. Palanichamy, Professor, Department of Civil Engineering for providing all necessary facilities to carry out the experiments. The author also wishes to thank all staff members, who have supported the experiments. REFERENCES
© IRSEN, CEERS, IAU
The following images related to this document are available:Photo images[st11055t1.jpg] [st11055f5.jpg] [st11055f1.jpg] [st11055t3.jpg] [st11055f2.jpg] [st11055f4.jpg] [st11055f6.jpg] [st11055f3.jpg] [st11055t2.jpg] |
| |||||||||

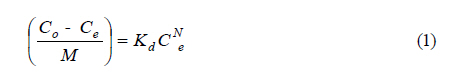
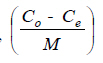 is the amount of contaminants adsorbed per unit weight of solid
[M/M], Kd is the
is the amount of contaminants adsorbed per unit weight of solid
[M/M], Kd is the