 |
| About Bioline | All Journals | Testimonials | Membership | News |
|
||||||
|
||||||
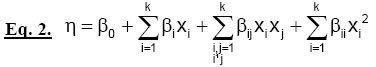
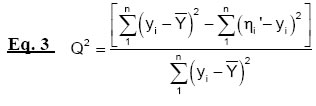
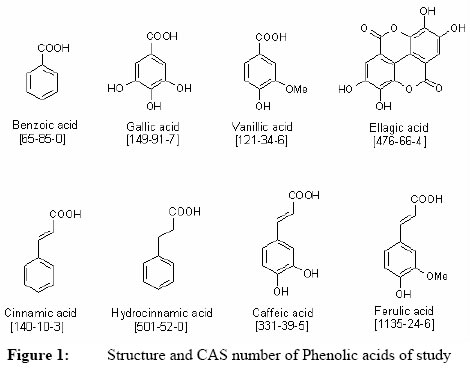
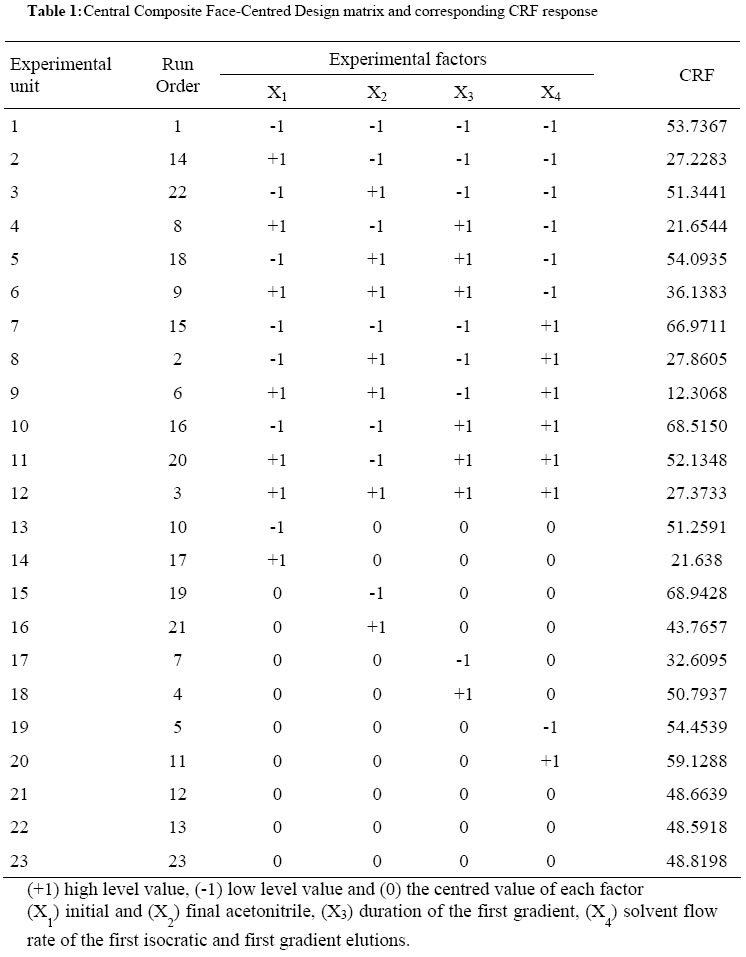
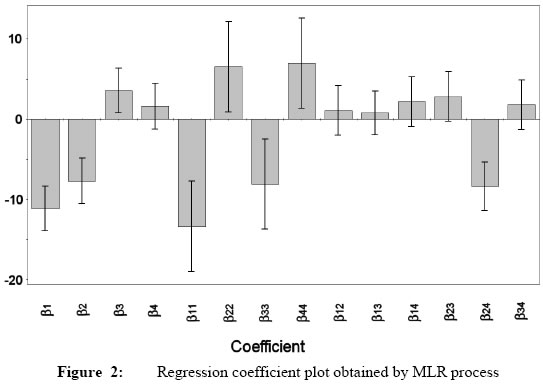
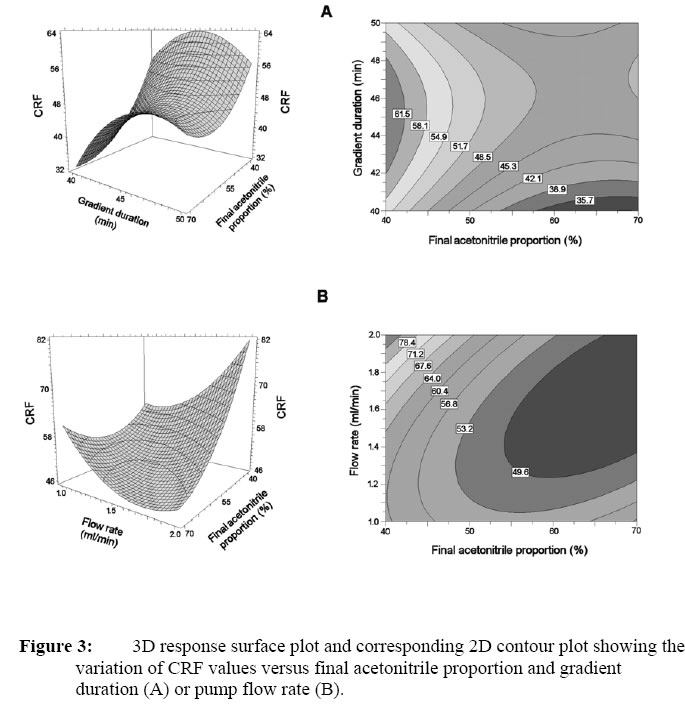
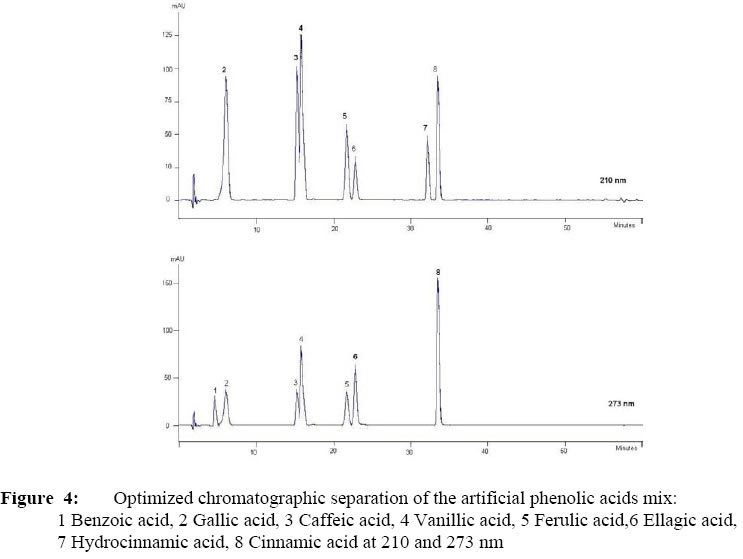
African Journal. Traditional, Complementary and Alternative Medicines Vol. 3, Num. 1, 2006, pp.115-128 EXPERIMENTAL DESIGN OPTIMIZATION FOR SCREENING RELEVANT FREE PHENOLIC ACIDS FROM VARIOUS PREPARATIONS USED IN BURKINA FASO FOLK MEDICINE Martin Kiendrebeogoa,*, Luc Choisnardb, Charles E. Lamiena, Aline Medaa, Denis Wouessidjeweb, Odile G. Nacoulmaa aLaboratoire de Biochimie et de Chimie Appliquées, UFR Sciences de la Vie et de la Terre, Université de Ouagadougou, 03 BP 7021 Ouagadougou 03, Burkina Faso bDépartement de Pharmacochimie Moléculaire (DPM), UMR CNRS 5063, Pharmacotechnie, Université Joseph Fourier, 38243 Meylan Cedex, France E-mail: martin.k@univ-ouaga.bf, kmartin71@hotmail.com Code Number: tc06013 AbstractExperimental design methodology was used to optimize the HPLC separation of various relevant phenolic acids from an artificial mixture. The effect of four characteristic factors of the HPLC procedure on the Chromatographic Response Function was investigated by a Central Composite Face-Centred Design and Multi Linear Regression fitting. The eight phenolic acids were successfully separated. The optimal HPLC setting condition was applied to rapid screening of free phenolic acids from Striga hermonthica (Del.) Benth. (Scrophulariaceae), Guiera senegalensis J. F. Gmel (Combretaceae) and unifloral honey from Acacia sp. (Mimosaceae). None of reference phenolic acid was identified in S. hermonthica extract when some of them were detected in G. senegalensis and honey extracts. This work is considered as a first step for a largest phenolic acids screening from various preparations used in Burkina Faso folk medicine to justify some of their properties or potentialities. Key words: Central Composite Face-Centred Design, Chromatographic Response Function, Phenolic acids Introduction Phenolic acids are plant secondary metabolites widely spread throughout the plant kingdom (Bruneton, 1993; Herrmann, 1989). Recent interest in phenolic acids stems from their potential as protective factors against cancer and heart diseases in part because of their potent antioxidative properties (Breinholt, 1999). They are also known to exhibit antibacterial effects (Weston et al., 1999) antimutagenic and anti-inflammatory activities in bacteria and mammalian (Loarca-Pina et al., 1998; Ihantola-Vormisto et al., 1997; Kaur et al. 1997). Besides, some phenolic acids were reported to be potent and selective inhibitors of human immunodeficiency virus type 1 (HIV-1) integrase (Middleton et al., 2000). Therapeutic uses of medicinal plants in Burkina Faso folk medicine could partly be assigned to their free phenolic acids (Nacoulma, 1996). A screening program on free phenolic acids in medicinal plants and foods from Burkina Faso is then undergoing in our laboratory to justify some their biological properties and potentialities. The potential healthful of phenolic acids have prompted the interest in developing analytical methodologies for their detection and measurement from plant sources. A number of analytical techniques have been presented for the analysis of phenolic acids, including thin-layer chromatography (Schmidtlein and Herrmann, 1975), gas-liquid chromatography (Schulz and Herrmann, 1980), gas chromatography-mass spectrometry (Wu et al., 1999), or capillary electrophoretic methods (Fernandez et al, 1996). However, high-performance liquid chromatography is presently the most widely used method (Amakura et al., 2000; Escarpa and Gonzales, 2000; Hahn et al., 1983). Despite the numerous HPLC methods for phenolic acids determination described in the literature, an optimized method, convenient for all phenolic acids from complex mixture like plant extracts is not available to our knowledge. Hence, this study aimed to develop an optimized HPLC method for the separation of caffeic, ferulic, vanillic, ellagic, gallic, benzoic, cinnamic and hydrocinnamic acids. Their choice was focused either on their relatively close structure and their well-known antimutagenic, antibacterial, antioxidant and anti-inflammatory activities (Rukkumani et al., 2004; Friedman et al., 2003; Op de Beck et al., 2003; Privadiarsin et al., 2002; Fernandez et al., 1998; Kaur et al., 1997; Fernandez et al., 1996; Garcia and Marhuenda, 1985; Wood et al., 1982). The selection of optimal HPLC operating conditions is rather difficult and complex for multi-component mixtures due to the high degree of process variable interaction. Several process variables must be investigated. HPLC methods development was traditionally accomplished through a trial-and-error process. This procedure is overly expensive due to both the time involved and the potential product wasted in the many experiments that must be performed to find acceptable, though not necessarily optimal, operating conditions. Experimental design methodologies, more practical and efficient, have been reported as a suitable tool to optimize HPLC separations (Karnka et al., 2002; Onjia et al., 2002; Klein and Rivera, 2000). It involves a statistical design of experiments, which uniformly samples the experimental domain to generate an experimental test matrix. Response or criteria functions are employed to quantify results numerically and rank chromatograms in order of their desirability. These criteria functions are mapped to response surface models, which are then optimized within the constraints of the experimental domain with respect to the process variables. In this paper, we propose an experimental design with HPLC for a suitable separation of caffeic, ferulic, vanillic, ellagic, gallic, benzoic, cinnamic and hydrocinnamic acids mixture. The optimization process was carried out on an artificial mixture and the optimal HPLC setting applied to biological samples.' Material and Methods Whole plant Striga hermonthica (DEL.) Benth (Scrophulariaceae) and galls from Guiera senegalensis J. F. Gmel (Combretaceae) were collected at Gampela (25 km, east of Ouagadougou, Burkina Faso). After being identified by Prof. Millogo, voucher specimens were deposited at the herbarium of the University of Ouagadougou as Lamien 01 (galls from Guiera senegalensis) and Kiendrebeogo 01 (Striga hermonthica). Honey sample (n°3) was collected from the east of Burkina Faso. Pollen morphologies were compared with reference slide from the Laboratory of Biology and Ecology, University of Ouagadougou. Sample was identified as Acacia sp. unifloral honey (Meda et al., 2005). Test samples preparationPlant extracts were obtained by refluxing 10 g of powdered material for 30 min with 100 ml of aqueous acetone 80 %. Acetone was removed under reduced pressure and the aqueous residue freeze-dried. A 10 mg/ml solution was made from a (1:1) methanol/water solution for HPLC analysis. Honey sample (25 g) was mixed with 125 ml acidic water pH 2 and filtered through an amberlite XAD2 column (25 x 2 cm). The column was eluted with 100 ml of acidic water pH 2, 300 ml of water and then 300 ml of methanol. Methanolic fraction was concentrated under reduced pressure and partitioned between water and diethyl ether. The organic phase was dissolved in 1 ml methanol for HPLC analysis. HPLC Chromasolv® methanol and G Chromasolv® water (Flucka chemie GmbH, Switzerland) were used to prepare samples solutions for HPLC analysis. Artificial Phenolic acids mixPhenolic acids (caffeic, ferulic, cinnamic, hydroxycinnamic, gallic, vanillic, benzoic, ellagic acid) were purchased from Sigma. Their structures and CAS numbers are given in Fig. 1. Standard mixture solution made in methanol (100 µg/ml of each of all phenolic acids) was used for the optimization procedure. HPLC system and chromatographic separation efficiency estimationThe liquid chromatographic system consisted of a Varian 9012 pump module, a Varian 9100 automatic sampler and a Varian 9065 UV detector. Star Chromatography Workstation software version 5.51 was used to acquire and analyse chromatographic data. All the experiments were performed on Kromasil C18 column (250 mm × 4.6 mm internal diameter, 10 µm particle size, 100 Å pore size). Ultraviolet detection was achieved at 210 nm and 273 nm. Samples (20 µl) were injected in triplicate. Gradient elution regimes were employed using HPLC Chromasolv® acetonitrile and 0.1 % (v/v) orthophosphoric acid in G Chromasolv® water (Fluka chemie GmbH, Switzerland). Orthophosphoric acid (85 %) was HPLC grade (Fischer scientific). The quality of chromatographic separation has been evaluated by the Chromatographic Response Function (CRF) (Karnka et al., 2002; Klein and Rivera, 2000). The CRF (Eq. 1) is a global quality criterion that allows specifying time and resolution parameters. Eq. 1. CRF=Σ Ri + La -b|TM-TL|-C(T0-T1) Where Ri is the resolution between adjacent pairs of peaks, L the total number of peaks, TM the maximal acceptable duration of analysis, TL the retention time of the last eluted peak, T0 the specified minimum retention time and T1 the retention time of the first eluted peak. a, b and c are the arbitrary weighting factors. To maximize L parameter, the weighting factors were fixed as following: a = 2, b = 1 and c = 1. All Ri values exceeding 2.0 were systematically discarded from CRF calculation to avoid overestimated CRF. Experimental designExperimental design was processed and analyzed using Modde 5.0 software. Central Composite Face-Centred Design (CCFD) was used because it requires only three levels for each factor and lead to a quadratic model (Eq. 2) which is efficient to describe a potentially complex function: Eq. 2. Where η is computed response of CRF, β0 the constant, βi the linear coefficients, βij the cross product coefficients, βii the quadratic coefficients, k the number of independent factors. Normality of the experimental data was examined using the Box-Cox transformation procedure (Box and Cox, 1964). Model coefficients were estimated with the well known Multi Linear Regression (MLR), which allows fitting of the observed response with the analytical model (Box et al., 1978). Initial model including all the coefficients was refined using stepwise technique (Yin and Carter, 1996). This procedure involves removing step by step each eligible coefficient in regard to subsequent statistic quality of the model. The model efficiency was estimated by the coefficient of correlation R2, the coefficient of determination R2Adj, the coefficient of prediction Q2 (Eq. 3) and the analysis of variance (ANOVA) based on the Fischer F-test. Eq.
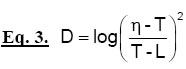
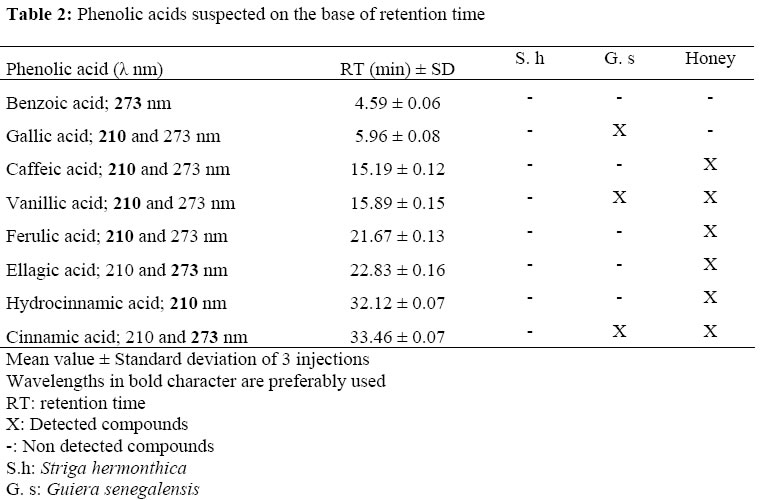
3 In this equation ηi’ represent a prediction of the ith observed response made from a model regressed on all of the available data except the ith observation (Eriksson et al., 2000). P-values criteria estimated by Student t-test was employed to control the coefficient to be removed. In this iterative approach, coefficient with the minus P-value was removed from the sub-model of the step. Stepping was stopped when statistic criteria corresponding to the best sub-model were obtained. Optimisation of the experimental conditions was extrapolated using Nelder Mead simplex method module, as implemented in Modde 5.0 software (Nelder and Mead, 1965). Then, predicted response efficiency (Eq. 4) was evaluated by “distance to target” coefficient (D) applied in only one response case (Eriksson et al., 2000): Eq.4. Where η is the computed response of CRF, T the desired response target and L the worst acceptable response value. Results and Discussion The CRF optimization study was carried out in two steps. First, the eight commercial phenolic compounds of interest were mixed together to obtain a complex test medium as a mimic of plant extract. The above artificial mix of the commercial phenolic acids was used to optimize the HPLC identificationby surface method procedure. In a second step, the optimal HPLC procedure was applied to the screening of natural extract from Striga hermonthica, galls of Guiera senegalensis and honey sample. The HPLC procedure was carried out in 3 steps: (i)An initial isocratic elution during 15 min for column equilibration (ii) A gradient elution during X3 min (to be determined through the optimization procedure) for phenolic acids separation (iii)A second gradient elution for 10 min followed by a 5 min isocratic elution to extract potentially by-products residuals from the HPLC column. Elution solvent was composed of acetonitrile and orthophosphoric acid 0.1 %. Optimization of the chromatographic separation was investigated on four factors implicated in the 2nd step (step ii): initial acetonitrile percentage (X1), acetonitrile percentage at the end of the first gradient elution (X2), duration of the first gradient elution (X3) and pump flow rate during the first isocratic phase and the first gradient elution (X4). Acetonitrile percentage as well as solvent flow rate at the end of the second gradient and during the last isocratic elution was settled at 75 % and 1 ml/min. The different factors levels values producing the experimental domain were chosen after brainstorming and some preliminary studies. Then X1 interval values were chosen between 1 and 5 % acetonitrile and X2 values between 40 and 70 % acetonitrile. X3 interval was limited by 40 and 50 min and X4 by 1 and 2 ml/min. Artefacts caused by the different magnitudes and units of the factors were avoided using variables explained in a centred coded levels. For each factor, (+1) constitute the high level value, (-1) the low level value and (0) the centred value. Due to the potential complex interactions suspected between the factors, the experimental design was chosen to support a quadratic model. CCFCD was then investigated in 23 experimental runs including 3 central points. Run sequence of experimental units was completely randomized to minimize the effect of noise and the chromatographic separation quality was evaluated using CRF (Table 1). No deviating experiment (outlier) was detected using Normal probability plot. Chromatographic method optimization The Box-Cox transformation of experimental raw data gives λlower = 0.5539, λmax = 1.0297, λupper= 1.5792 at 95 % confidence level. No data transformation was then necessary to improve the model (Draper and Smith, 1981; Box and Cox, 1964), assessing the normal distribution of experimental data. The model coefficients were obtained by fitting the worksheet data by MLR. Fig. 2 shows all the regression coefficients and their uncertainty given by 90 % confidence interval. The best sub-model (Eq. 5) adopted by the stepwise technique for the CRF response was obtained as described in material and method section: Eq. 5. The coefficient of correlation R2 = 0.959 and the coefficient of determination R2Adjusted = 0.918 showed that quadratic model is well fitted by MLR. The CRF response is very well predicted as indicated by the coefficient of prediction Q2 = 0.773. Generally speaking, Q2 > 0.5 is considered to be good, Q2 > 0.7 very good, and Q2 > 0.9 excellent (Eriksson et al., 2000). Besides, R2 and Q2 difference was favourably inferior to 0.2. The ANOVA analyse shows that probability for the model regression is significant at 95 % (P-value = 0.000 << 0.05) but the probability for lack of fit is significant at 95 % (P-value = 0.001 < 0.05). However, the model validity was not dramatically depreciated by this slight lack of fit because the predictive power evaluated by the coefficient of prediction Q2 was greater than 0.5 (Eriksson et al., 2000). In the statistically point of view, the quadratic model appears good within the range of variables employed. The positive sign of the linear coefficients (βi) refers to an increasing effect on the CRF response, whereas the negative sign indicate a decreasing effect on this response. Direct determination of optimal factor setting was very difficult in regard to the number and the antagonist influence of interaction and quadratic terms also implicated in the model. For example, final acetonitrile proportion have a decreasing effect (β2 = -8.4611) on CRF response but an increasing effect is observed in interactions with phase duration (β23 = +3.3337), in interactions with pump flow rate (β24 = +8.34727) and within quadratic effect (β22 = +6.59799). Analysis was aided by surface response plot drawn from the model when varying two factors while the other factors were kept constant at the medium level (xi = 0). For sake of simplicity, only the response 3D surface plot and corresponding 2D contour plot for X2 and the other significant factors set one by one were reported in Fig. 3. As illustrated, the CRF was maximized for the following setting parameters: the final concentration of acetonitrile (X2) was minimized, the initial concentration of acetonitrile (X1) to about 2 %, the gradient duration (X3) to about 45 min and the pump flow rate (X4) to about 2 ml/min. Further, to determine more precisely the optimal factors range, a Nelder mead simplex method was investigated. This method has an advantage over the response surface plot and 2D contour plot because the response is optimized using all the factors in the same time. Then, an interesting value for CRF was arbitrary focused to 76. The experimental conditions predicted by the model were: Initial acetonitrile (X1) = 2 %; Final acetonitrile at the end of gradient I (X2) = 43 %; Gradient I duration (X3) = 45 min and Flow rate (X4) = 2 ml/min. Thus, factors settings were very close to the previous tendencies obtained by plot analysis. Experimental investigation was carried out with this experimental setting to check the adequacy of the model. Calculated CRF of 68.6 was in accordance with the predicted CRF value within confidence interval of 99 %. Consequently, the quadratic model was statistically and experimentally found to be good. The chromatographic profiles at 210 and 273 nm of the artificial phenolic acids mix obtained with the optimized HPLC method are illustrated by Fig 4. In our operating conditions, hydrocinnamic acid was only detected at 210 nm when benzoic acid was detected at 273 nm. The other phenolic acids were detected at both 210 and 273 nm. However, 210 nm is more suitable for gallic, caffeic, vanillic, ferulic and hydrocinnamic acids when ellagic and cinnamic acids were better detected at 273 nm. The retention time and suitable wavelength corresponding to the different relevant free phenolic acids in the optimized HPLC procedure were summarized in Table 2. The optimized chromatographic method was successfully applied to the screening of free phenolic acids from Striga hermonthica, Guiera senegalensis and Acacia sp. honey. Results are summarized in Table 2. In comparison with the standard mix reference, relevant free phenolic acids may be encountered in galls of G. senegalenesis and the unifloral honey of Acacia sp., S. hermonthica didn’t contain any. Gallic, vanillic and cinnamic acids were identified in G. senegalenesis when caffeic, vanillic, ferulic, ellagic hydrocinnamic and cinnamic acids were detected in the honey sample. In previously published work, gallic acid was identified in G. senegalenesis (Bouchet et al., 2000) when caffeic, vanillic, ellagic, hydrocinnamic and cinnamic acid were identified (Gheldorf et al., 2002; Thomas-Barberan et al., 2001; Amiot et al., 1989) from the unifloral honey of Acacia sp. ConclusionIn conclusion, this experimental design methodology allows us to set HPLC conditions for optimized separation of 8 relevant free phenolic acids. These conditions were successfully applied to the screening of S. hermonthica, G. senegalensis and honey extracts. This study is a preliminary to a largest screening of phenolic acids from Burkina Faso medicinal plants in order to correlate them with their antioxidant properties and biological benefits. AcknowledgmentsThe authors are grateful to the International Atomic Energy Agency (IAEA) for providing the financial support BKF/03030P through TCP BKF/5/002 “Mise au point d'un médicament vétérinaire contre la variole aviaire” which allowed this study. References
|

