 |
| About Bioline | All Journals | Testimonials | Membership | News |
|
||||||
|
||||||
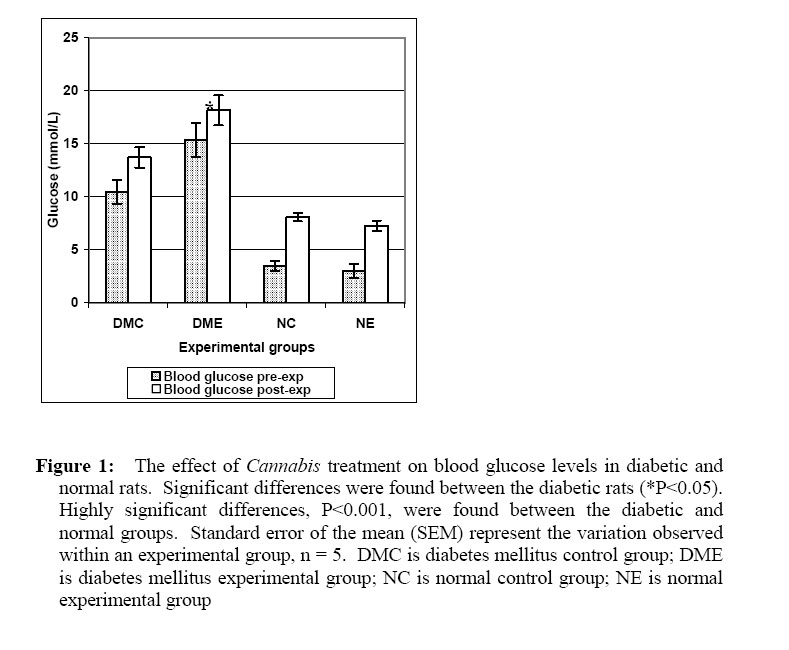
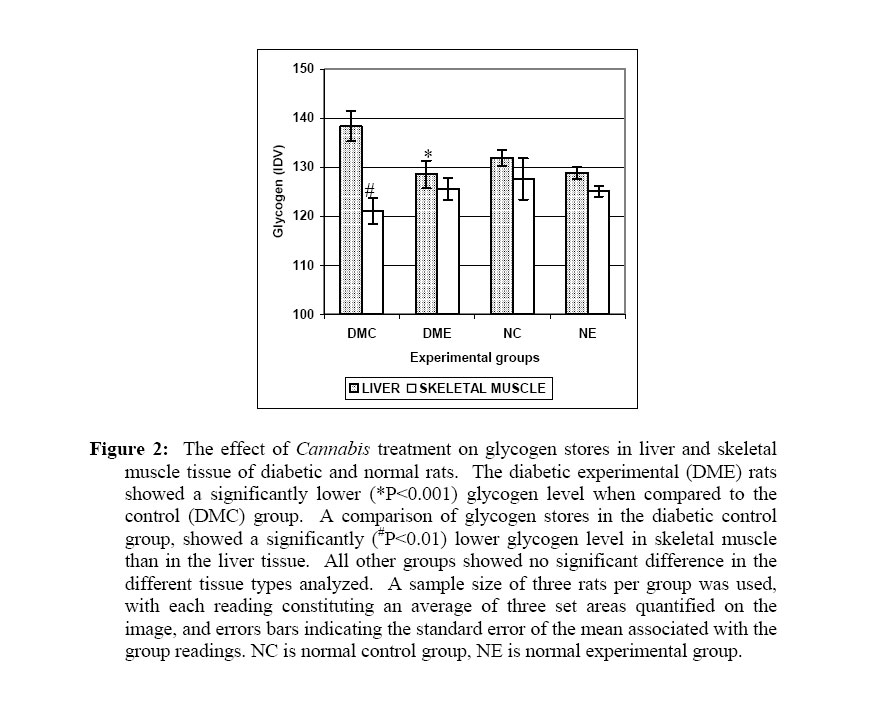
African Journal of Traditional, Complementary and Alternative Medicines, Vol. 3, No. 4, 2006, pp. 1-12 Research Paper IN VIVO EFFECTS OF CANNABIS SATIVA L.EXTRACT ON BLOOD COAGULATION, FAT AND GLUCOSE METABOLISM IN NORMAL AND STREPTOZOCIN-INDUCED DIABETIC RATS R-A. Levendal* and C. L. Frost Department of Biochemistry and Microbiology, Nelson Mandela Metropolitan University, PO Box 77000, Port Elizabeth, 6031*E-mail: Ruby-Ann.Levendal@nmmu.ac.za, Tel. +27 41 504 2019, Fax: +27 41 504 2814 Code Number: tc06047 AbstractCannabis sativa is used in indigenous medicine as a treatment for various ailments, including diabetes, and also as an early treatment for snake-bite. In diabetic patients, approximately eighty percent die from a thrombotic death and the development of atherosclerosis is accelerated. This study investigated the effects of Cannabis sativa on normal and streptozocin (STZ)-induced diabetic rats, with the aim of determining its effects on glucose and fat metabolism. The following metabolic changes were observed in Cannabis-treated rats: decreased growth rates (normal only), increased liver weights (diabetic only), decreased left rectus femorus muscle mass (normal only), increased total plasma cholesterol levels, increased plasma triglyceride levels (diabetic only), reduced hepatic and skeletal muscle glycogen content (only significant in diabetic hepatic tissue), reduced blood glucose levels (normal group, but not significant). Furthermore, there was a three-fold prolongation in the blood clotting time in the diabetic experimental group relative to the diabetihttp://www.bioline.org.br/request?tc06047c control group. A similar trend was observed between the control and experimental normal rats. The results indicate that Cannabis sativa increased energy utilization due to a reduction in energy reserves, and has an anticoagulatory effect. However, the mechanisms associated with these effects need to be further investigated. Key words: Cannabis sativa, Streptozocin, diabetes mellitus, coagulation Introduction South Africa has a plethora of flora being utilized for various purposes, viz. spiritual, medicinal, and decorative. Amongst the many medicinal uses, Cannabis sativa has been used for the treatment of disorders such as diabetes and as an early treatment for snakebite (van Wyk and Gericke, 1997). Besides being used as medicinal agents, Cannabis is widely used as a recreational drug, predominantly for the psychoactive effect of the major active constituent, viz. Tetrahydrocannabinol (THC). THC is only one of the more than 60 cannabinoids, and 200 to 250 non-cannabinoid constituents found in Cannabis. It stands to reason therefore that a rational basis exists for the persistent use of this plant through time, and that there should be ongoing scientific research directed at the transformation of this plant from illicit drug into a medicinal herbal product with therapeutic benefits. Globally it is estimated that approximately 150 million people suffer from diabetes mellitus, and that this number may double by 2025. Many of these cases occur in developing countries due to population growth, ageing, unhealthy diets, obesity and sedentary lifestyles (WHO, 2002). The prevalence of diabetes in South Africa has escalated in the black population over the past 20 years (Punyadeera et al., 2002). With an escalation in the prevalence of diabetes, one should remain mindful that eighty percent of diabetic patients die a thrombotic death, and atherosclerosis is also accelerated in diabetic patients. Endothelial abnormalities play a role in the enhancement of platelet activation and clotting factors in diabetic individuals (Carr, 2001). Alternative methods to the current pharmacotherapeutic approaches are desperately needed due to the inability of the modern therapies to control all the pathological effects of the disorder, and the cost and unavailability of resources in many rural communities in developing countries. This has fueled the global upsurge in research on the use of medicinal plants and their use in traditional healing over the past 20 years, in an attempt to adequately manage this disorder (Ojewole, 2002). In Africa, many rural communities rely heavily on the use of numerous medicinal plants to manage diabetes mellitus, however, few have received scientific scrutiny (Ojewole, 2002). Since Cannabis sativa L is used in indigenous medicines as a treatment of diabetes, the aim of this study was to examine the effect of an organic Cannabis extract on the fat and glucose metabolism in normal and streptozocin-induced diabetic Wistar rats. Materials and Methods The experimental protocol used in this study was approved by the Ethics Committee of the University of Port Elizabeth, Port Elizabeth, 6000, South Africa, and conforms to the “Guidelines for the Care and Use of Experimental Animals” as published by the University of Port Elizabeth, Port Elizabeth, 6000, South Africa. All reagents used for experimental procedures were of a good analytical quality. Plant material Dried Cannabis plant material was obtained from the South African Police Services in Humewood, Port Elizabeth, after being issued with a permit (UPE 82/2003/2004) in terms of the Medicines and Related Substances Control Act 1965 of South Africa. The plant material consisted of leaves, stems, flowers and seeds. Preparation of plant extract An extraction was done using a modified method of Agurell et al. (1984). Ten grams of plant material was immersed in 30 ml of chloroform for 1 hour with occasional stirring. After an hour, the chloroform extract was poured off and filtered through cheesecloth. This step was repeated, after which the combined extract was filtered through regular filter paper (Whatman no. 1). The extract was evaporated under a gentle stream of nitrogen at 4°C in a container protected from illumination. The remaining resin was redissolved in methanol and stored under vacuum, at 4°C until needed. Before injecting the extract into the experimental rats, the methanol was evaporated using speedvac (Savant SC100), and the pellet formed was re-suspended in Tween 80 (Sigma), that was made up to a 1% solution in saline. This 1% Tween 80 served as the vehicle. HPLC Quantification A reverse phase separation was done using High Performance Liquid Chromatography (HPLC) (128 Gold System, Beckman), to quantify the THC content in the extract against a THC standard (Industrial Analytical (Pty) Ltd, Johannesburg, South Africa). A µBondapak C18 10 µm (0.25 x 20 cm) column was used. The mobile phase was a mixture of Acetonitrile and 0.01M phosphate buffer at a pH of 7.4, at a ratio of 70:30, and a flow rate of 1 ml/min. Animal material Male Wistar rats (Ratus norvegicus), weighing between 300–360 g were used. The animals were randomly divided into diabetic (DM) and normal (N) groups and these groups were further subdivided into experimental (Cannabis-treated), designated as “E” and control (vehicle-treated), designated as “C”. All animals were kept in an air-conditioned animal room (22 ± 3°C) under a 12 hour light/dark cycle and fed on normal rat chow and tap water ad libitum for the duration of the experiment. All experimental groups were assigned 6 rats, however, only 5 rats survived in the diabetic experimental group. Diabetes induction Diabetes was induced by a single intravenous injection through the tail vein. The STZ solution was prepared in 0.1 M ice cold citrate buffer, pH 4.5, and administered at a dosage of 80 mg/kg body weight. Rats from the normal group were injected with the citrate buffer only. Diabetes was allowed to develop in the STZ-treated rats over 2 days, after which the diabetic state was confirmed on the third day, using the intra-peritoneal glucose tolerance test (IPGTT). The STZ-treated rats showing glucosuria (Uristix, Bayer’s, SA) and fasting blood glucose in the range of 250 mg/dl (Accutrend GC, Roche, SA), were selected for this study. Experimental procedure The experiment commenced one day after diabetes was confirmed and lasted for 21 days. The experimental groups of both the diabetic and normal rats were treated every alternate day with an equivalent of 5.0 mg THC per kg body weight via subcutaneous injection, for the first 5 injections, with the dosage being reduced to 2.5 mg THC per kg body weight thereafter. The control groups were treated in a similar manner as the experimental groups, except their injection contained the vehicle only. On termination of the experiment, all animals were sacrificed using Euthanase and various tissues, viz. blood, liver, epididymal fat, and left rectus femorus muscle were harvested for further analysis. Blood sampling Blood samples were obtained from the tail vein for blood glucose analysis using the Accutrend GC glucometer (Roche, SA). Approximately 2 ml of blood was obtained from each pre-experimental animal via intra-ventricular puncture, placed in a centrifuge tube containing anticoagulant and centrifuged at 3000 rpm for 15 minutes. Post-experimental blood was drawn from the ventricles of each rat at the termination of the experiment. The plasma collected was stored at –20°C until used for the determination of total cholesterol, HDL-cholesterol, and total triglyceride levels, as well as thrombin clotting time. Assays were conducted using standard assaying protocols adapted for the use of a Multiscan Transmit microtiter plate reader (Labsystems, Finland). Total cholesterol, HDL-cholesterol, total triglyceride determination and Atherogenic Index calculation All these assays were performed using a microtiter plate and the method stipulated by the manufacturer was therefore modified accordingly. Due to limited plasma, samples were pooled, and each assay was completed in triplicate for each experimental group, with data expressed as mean ± SD. Triglyceride levels were determined using the Triglyceride GPO-PAP kit (Roche, SA) (Stein and Myers, 1995). The Cholesterol CHOD-PAP kit (Roche, SA) was used for total cholesterol determination (NIH, 1990). Determination of HDL-cholesterol was done using the HDL-cholesterol precipitant (Roche, SA) on the same pooled samples and calculating the difference in absorbance, measured at 540nm, between total cholesterol and HDL-cholesterol readings (Lopes-Virella et al., 1977). The Atherogenic Index (AI) was calculated as follows: (total cholesterol – HDL-cholesterol)/HDL-cholesterol. Thrombin clotting time assay The thrombin clotting time assay is the measure of the time taken for plasma to start clotting after the addition of bovine thrombin (50 U/ml, Sigma-Aldrich). The thrombin time was measured using the modified method of Poller and Thomson (1983). Incubate for 5 minutes at 37°C in waterbath/incubator, then take 40 readings at 25 second intervals (with constant shaking) at 410 nm wavelength. The blank contained 10 μl saline instead of thrombin. Due to the limited volume of pre-experimental plasma, only post-experimental assays were performed in triplicate on pooled blood samples. Light microscopy Liver and skeletal muscle tissue wax sections were subjected to a diastase digestion, after which the Periodic Acid-Schiff (PAS) technique was used to detect glycogen (Bancroft and Stevens, 1996). In diastase-treated sections, glycogen would have been catabolised, so no glycogen would show up when using the PAS stain. The nuclei stained blue. Digital images were captured using an Olympus Camedia digital camera linked to an Olympus System microscope Model BX60 (Olympus optical co., Ltd, Japan). The AlphEaseFC Imaging Software package was used for analysis of the images. Data analysis All data are expressed as mean ± SEM, except where pooled plasma samples had been used (cholesterol, HDL-cholesterol, triglycerides and blood clotting where mean ± SD was used). Differences between the various experimental groups were statistically analysed using Student’s t-test, P≤ 0.05. Results In order to correctly analyse the data shown in Table 1, it is important to note that the body weights of the STZ-induced diabetic control (DMC) and experimental (DME) rats, just prior to the STZ injection, were 343.77 ± 2.77 g and 340.18 ± 3.25 g, respectively (not shown in Table 1). From the time of STZ administration until the start of the experiment, which equated to a period of 4 days, the weights of these rats decreased by approximately 39 g. The Cannabis-treated rats showed a lower gain in body weight, relative to control animals (Table 1). Despite showing an overall increase in body weight over the experimental period, the normal experimental (NE) group differed significantly (P<0.001) from the normal control (NC) group, showing a gain of 30.25 ± 4.6 g (P<0.02), and 58.44 ± 4.19 g (P<0.0001), respectively. Both diabetic groups showed a reduction in body weight, however, it was not found to be significant. All the diabetic rats showed signs of hyperphagia, which was significantly higher (P<0.0001) than the food consumption of the normal rat group. However, the NC rats ate (699.18 ± 14.66 g) significantly more, than the NE rats (604.75 ± 10.19 g), P<0.0002. A significant difference, P<0.02, was observed in the skeletal muscle (left rectus femorus muscle) weights of the NC (4.31 ± 0.10 g) and NE (4.05 ± 0.15 g) groups, but no difference was found between the diabetic groups. Post-prandial blood glucose levels differed significantly (P<0.01) between all the pre- and post-experimental samples, except DMC. The post-experimental blood glucose levels in the diabetic experimental group was significantly higher (P<0.03) than the diabetic controls, however, this was not found in the normal rats (Figure 1). The post-experimental blood glucose levels in the NE group was found to be lower than that of the NC group, however, this was not statistically significant. Glycogen content in liver tissue of diabetic and normal rats showed an overall reduction, with the DME rats containing significantly less, P<0.001, than the DMC rats (Figure 2). In the skeletal muscle of the diabetic group, the glycogen stores in the control group was less than that found in the experimental group, but this was not statistically significant. The glycogen content in livers of diabetic rats was significantly higher than that found in the skeletal muscle tissue (P<0.01). Liver glycogen stores in the normal control and experimental groups showed a similar trend to the diabetic group. However, in the normal rats, the skeletal muscle glycogen content in the experimental group was lower than that in the control group. These differences observed were not statistically significant. Table 1: Effect of Cannabis sativa L. treatment on body weight, food intake, and post-experimental epididymal fat and skeletal muscle mass
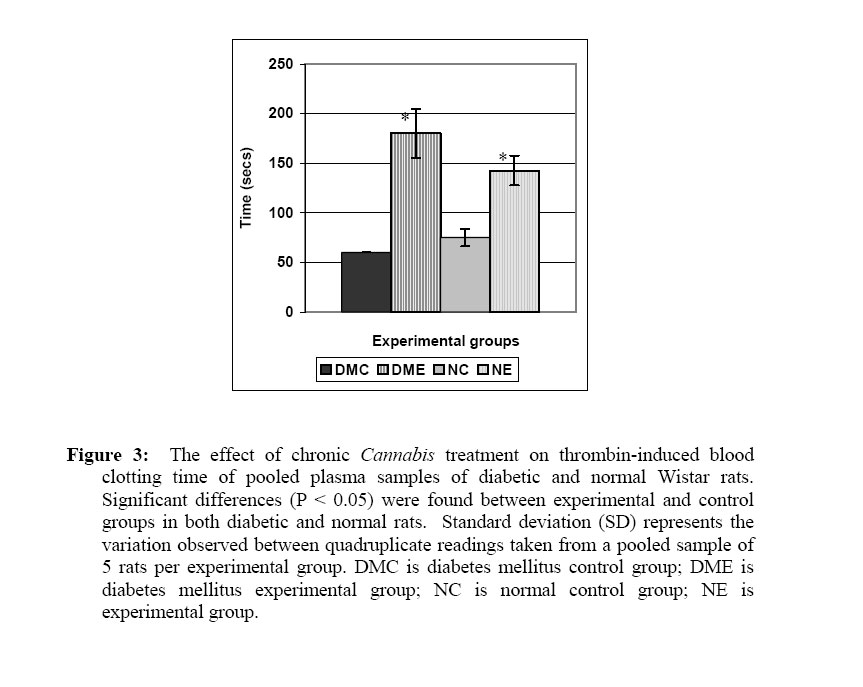
a P<0.05: DMC vs DME Standard error of the mean (SEM) represent the variation observed within an experimental group, n = 5. DMC is diabetes mellitus control group; DME is diabetes mellitus experimental group; NC is normal control group; NE is normal experimental group. As indicated in Table 2, the total plasma cholesterol levels were significantly higher in the DME group (P<0.02) when compared to the DMC group. However, the HDL-cholesterol in these Cannabis-treated diabetic rats were found to be significantly higher (P<0.02) than their control counterparts. The plasma triglyceride levels were abnormally high in the diabetic group. The DME rats were found to have significantly higher levels, 27.70 ± 0.16 mmol/L, P<0.00001, relative to the DMC, 10.05 ± 0.12 mmol/L. The plasma triglyceride levels showed a 2.8-fold increase in the diabetic experimental group. The NE group showed a 1.6-fold reduction in plasma triglycerides, 0.5 ± 0.01 mmol/L, P<0.0001, relative to the NC group, 0.81 ± 0.02 mmol/L. Total cholesterol and HDL-cholesterol levels showed no statistical difference between NC and NE rats. Despite the hyperlipidemia found in the diabetic groups, the thrombin clotting time was significantly (P<0.002) prolonged in the Cannabis-treated rats. Normal experimental rats also showed a significant prolongation (P<0.02) in thrombin-induced clotting time (Figure 3). Table 2: Effect of Cannabis sativa L. treatment on total cholesterol, HDL-cholesterol and triglycerides in pooled plasma samples and Atherogenic Index (AI) of diabetic and normal Wistar rats
a P<0.02: DMC vs DME Standard deviation (SD) represents the variation observed between quadruplicate readings taken from a pooled sample of 5 rats per experimental group. DMC is diabetes mellitus control group; DME is diabetes mellitus experimental group; NC is normal control group; NE is experimental group. Discussion and conclusion The mainstay of non-pharmacological diabetes treatment is diet and physical activity. However, 40% of diabetes sufferers need oral agents for satisfactory blood glucose control and about 40% need insulin injections (WHO, 2002). Since insulin is unavailable and unaffordable in many developing countries, their communities have to opt for alternatives that have similar hypoglycaemic effects as insulin. Both the type 1 cannabinoid receptor (CB1) and endocannabinoids have been associated with the brain regions that control food intake (Howlett et al., 2002). Animal studies that have been conducted using Cannabis or THC, have shown varied effects to acute treatment of Cannabis. This difference in effect may be explained by the variation in potencies of the Cannabis preparations. The weak preparation (‘bhang’) acts as an anorexigenic agent, while the potent preparations (‘ganja’, ‘charas’) inhibit appetite. In humans smoking one or more marijuana cigarettes, THC levels in peripheral blood exceeded the range of 5 to 250 ng/ml, while intravenous administration of 10 mg/kg THC resulted in a blood level of 720 ng/ml after 20 minutes (Safarian et al., 2003). The significant differences in food intake and associated reduction in body weight between the experimental and control groups could therefore, in part, be due to the factors mentioned above. Other studies have shown that cannabinoids increase adrenocorticotropin (ACTH) secretion (Pagotto et al., 2001) and are also involved in the stress-response (Navarro et al.,1997). Since the aforementioned physiological processes are geared at mobilizing energy through the activation of lipolysis and protein catabolism, the differences in body composition observed in the experimental animals, could possibly also be attributed to these physiological responses. In order to verify whether energy expenditure had increased, glycogen stores were analyzed. From the results obtained, the experimental diabetic group showed significantly lower (P<0.02) hepatic glycogen stores than the control group. The normal experimental group also showed reduced hepatic glycogen, but this difference was not statistically significant. A decrease in hepatic glycogen stores is commonly observed in studies associated with cannabinoid exposure, more especially THC. In another study on dogs conducted by De Pasquale et al. (1978), he showed that administration of Cannabis resin increased blood glucose and ammonia levels, whilst concomitantly decreasing plasma insulin levels. This supports our observations. The increase in blood ammonia levels may be related to the inhibitory effect of Cannabis on the incorporation of amino acids into proteins, thus resulting in an increased availability of amino acids to the catabolic pathways coupled to an increase in the glutamate dehydrogenase activity (Ghoneim et al., 1980). Niederhoffer et al. (2001) exposed adrenal medullary cells to the CB1 receptor agonists, WIN55212-2 and CP55940, and found that cannabinoids inhibit epinephrine release in vivo and in isolated adrenal glands. Since epinephrine enhances blood glucose and fatty acid levels (through enhancing lipolysis), the changes in body composition observed in these experiments cannot be attributed to the physiological actions of catecholamines. With the changes in the biochemical pathways that are used to generate energy, the blood profile of diabetics varies from that of nondiabetic individuals. Dyslipidemia found in the diabetic group is typical of diabetics. Despite the high levels of triglycerides in the diabetic group, the Atherogenic Index(AI) associated with all the experimental groups were found to be very low, with the Cannabis-treated rats showing a lower AI, though not statistically significant. Diabetic patients are also considered to have a hypercoagulable state since they have an increased risk of thrombosis and are at risk of developing atherosclerosis. In these patients, the following abnormalities are common: vascular endothelial derangements which enhances activation of platelets and clotting factors, elevated coagulation activation markers like Prothrombin Fragment 1 + 2 and thrombin-antithrombin complexes, elevated plasma clotting factors like Fibrinogen, factor II, factor VIII, factor XI, factor XII, kallikrein and von Willebrand factor, and the anticoagulant protein C and the fibrinolytic system is relatively inhibited (Carr, 2001). Inflammation is an integral part of atherosclerosis and has been associated with hypercoagulability and thrombosis (Thor et al., 2002). It has also been demonstrated that crude Cannabis extracts have potent anti-inflammatory activity (Zurier, 2003). However, it should be noted that marijuana smoking and cannabinoids such as THC, has been shown to modulate cytokine responses associated with both pro-inflammatory and anti-inflammatory effects. Generally speaking, anti-inflammatory effects are observed in various cell types like alveolar macrophages, T helper cells and other immune cell lines, showing a decrease in TNF-α, GM-CSF, IFN-γ and IL-10. However, Klein et al. (2000) have observed pro-inflammatory effects, particularly elevation of the chemokine, IL-8. Henke et al., (2001) showed that IL-8 enhances thrombus resolution, and this could possibly also contribute to the significant delay in the thrombin-induced clotting time observed in this experiment. From this investigation, Cannabis treatment does show potential in countering the hypercoagulation problems experienced by diabetics. Additional studies performed in our laboratory compare favourably with those obtained in this study. In vitro coagulation studies performed on human plasma exposed to Cannabis extract, and two of the major cannabinoids, viz. THC and CBN, displayed anticoagulant, more specifically, antithrombotic activity. In an in vivo study performed on obese and lean rats, respectively, the same THC regime as the STZ rats were followed. Plasma obtained from these rats showed a prolonged clotting time and a reduced atherogenic index, relative to control, despite the changes in their plasma lipid profile (Coetzee et al., in press). The Cannabis treatment did alter the energy metabolism, resulting in a reduction in energy reserves, and prolonged blood coagulation. Since the pancreatic β cells were destroyed in this Type I model, future experimentation should possibly incorporate the Type II diabetic model, so that the actual effect on the pancreatic β cells can be investigated, particularly because of the changes in body composition observed. Further experimentation is also needed to determine the mechanism by which Cannabis exert its effects on the coagulation pathways, resulting in the prolongation of coagulation, this despite the dyslipidemia that characterize diabetic blood profiles. Acknowlegments The authors wish to express their appreciation to the Nelson Mandela Metropolitan University and the National Research Foundation for their financial support, and also to Pathcare for their assistance in the preparation of the slide specimens. References
© Copyright 2006 - African Journal of Traditional, Complementary and Alternative Medicines The following images related to this document are available:Photo images[tc06047f1.jpg] [tc06047f3.jpg] [tc06047f2.jpg] |
| |||||||||