 |
| About Bioline | All Journals | Testimonials | Membership | News |
|
||||||
|
||||||
Tanzania Journal of Health Research, Vol. 11, No. 3, July, 2009, pp. 136-143 Three years of HIV/AIDS care and treatment services in Tanzania: achievements and challenges G. Somi1, M. Matee2*, C.L. Makene1, J. Van Den Hombergh1, B. Kilama1, K.I. Yahya-malima2, P. Masako1, D. Sando1, J. Ndayongeje1, B. Rabiel1 And R.O. Swai1 Ministry of Health and
Social Welfare, P.O. Box 9083, Dar es Salaam, Tanzania Received 20
April 2009 Code Number: th09024 Abstract The Tanzania HIV Care and Treatment Plan was launched in October 2004 aiming at providing 440,000 AIDS patients with antiretroviral drugs (ARVs) and track disease progression in 1.2 million HIV+ persons by the end of the 2008. This paper is intended to provide information to stake holders of the achievements and challenges of the HIV Care and Treatment Plan since its inception in 2004. Facility patient reports are aggregated at district and then regional level before being sent to the national level where they are aggregated to form a national report. By December 2007, 210 health facilities were offering HIV care and treatment services in Tanzania. About 123,147 (5 %) of the 2,636,785 estimated people living with HIV and AIDS were enrolled, and 71,439 (13.6 %) of the estimated 527,357 AIDS cases commenced ART. More females than males started ART, F: M ratio being 3: 2. Most (49 %) patients were started ART due to low CD4 counts (<200). About 6,618 patients had their initial ARV regimen changed due to starting anti-TB treatment 679 (10 %), peripheral neuropathy 812 (12%), skin rash 378 (6 %), and stock out 247 (4 %) or other reasons (18 %), while 2,653 (42 %) had no reason recorded. The proportion of patients still alive and on ART at 6, 12 and 24 months after initiation of treatment was 60 %, 60 % and 50 %, respectively, while those collecting ARVs on schedule was 34 %, 25 % and 10 % respectively. About 3,084 patients developed TB after starting ART, of whom 1,557 (~50%) patients during the first three months of treatment. During the three years (2004-2007) of HIV care and treatment services in Tanzania, there has been an increase in the number of CTC facilities, geographical coverage of services, the number of enrolled patients and those on ART. However, the set target for ART services has not been achieved and there are significant geographical variations in these achievements, which do not correspond with either population density or disease burden. Efforts should be made to i) ensure equitable accessibility when scaling up ART services in Tanzania, ii) improve the recording and reporting system, and iii) harmonize the activities of various stakeholders. Key words: HIV, AIDS, care, treatment, Tanzania Introduction Universal access to HIV prevention, treatment, care and support is not only achievable; rather it is a public health and human rights imperative, which has been agreed to by the United Nations member states and international donors. It is expected that many nations will meet specific universal access targets (such as prevention of mother to child transmission of Human Immunodeficiency Virus (PMTCT) or anti-retroviral therapy (ART) by 2010, while many others will meet them in 2011, 2012, and/or subsequent years. The focus of World Health Organization (WHO), the Joint United Nations Programme on HIV/AIDS (UNAIDS) and others is to ensure that all states meet the goal as early as possible (UN, 2003). As of December 2007, an estimated 9.7 million of the people living with HIV in low- and middle-income countries urgently needed this life-saving ARV medication. Of these only 2.99 million, just under a third, were accessing the drugs (WHO, 2006). Though shockingly small, this figure represents a great advance since 2003, when only 400,000 were receiving treatment. At the UN General Assembly Meeting on HIV/AIDS on 22nd September 2003, WHO, UNAIDS and the Global Fund declared the lack of access to HIV treatment a global health emergency (WHO, 2006). Since that meeting much progress has been made. Many countries have set targets for scaling-up treatment, and global organizations and funding bodies are rolling-out plans to increase ARV coverage. In Tanzania, only about 3, 000 people living with HIV/AIDS in Tanzania were reportedly receiving ART as of December 2004, against a backdrop of an estimated 440, 000 PLHA in need (URT, 2003). In recognizing this situation, multiple efforts have been made to increase access to ART leading to the Government launching its ART programme in October 2004. . The main focus of the programme is a rapid scaling up of ART, aimed at having more than 400, 000 patients on ART by the end of 2008 and, at the same time, track disease progression in 1.2 million HIV+ persons who are not eligible for ART (URT, 2003). In this regard, the United Republic of Tanzania mobilized its own resources as well as significant international resources from several other sources, including multi- and bilateral development partners such as the Global Fund for AIDS, TB and Malaria (GFATM) (GFATM, 2003), the World Bank-supported Multi-country AIDS Programme Tanzania (TMAP), the William J Clinton Foundation and the United States President’s Emergency Plan for AIDS Relief (PEPFAR) (WJCF, 2003). Since the onset of HIV care and treatment services in October 2004, implementing facilities routinely record and report patient management information. Each month, facilities summarize records and use the information to improve service provision and initiate information flow to the district, regional and national levels where it is compiled to a national report for dissemination. On the other hand, facilities that manage data electronically export patient-level data to the national level for analysis. This report, which is a summary of the analysis of facility reports that were received at the National AIDS Control Programme (NACP) as of December 2007, is intended to provide information to stakeholders on the progress that has been made in the provision of HIV care and treatment services in Tanzania. Specifically the report analyses the types of facilities providing services and their performance, patient monitoring information and treatment outcomes as assessed by a set of national monitoring indicators. Materials and Methods Recording and reporting tools In Tanzania, provision of HIV care and treatment services started together with its routine recording and reporting system in October 2004. The recording and reporting system focuses on patient monitoring at facility level and consists of eight tools; five recording and three reporting tools. The recording tools have two cards, the CTC1 and CTC 2, and Pre ART and ART and cohort analysis registers. The reporting tools are the monthly and quarterly cross sectional report forms, and a cohort analysis report form. The two recording cards (CTC 1) and (CTC 2) have individual information on clients attending CTC and feed information to Pre ART or ART register depending on whether the client has started ART or not. The Pre ART register is used to record information from clients who have not yet started ART and is used to compile cross-sectional information. Once patients are started on ART they are transferred to ART register, which is used to track patients on ART for up to 72 months and provides treatment outcome information for feeding the cohort analysis report form. Reporting tools are of two types namely cross sectional and cohort. The cross sectional report has two parts, the monthly report that provides information on cumulative and current numbers in care and on ART and the quarterly report provides information on drug use. The cohort analysis report provides information on treatment outcome of clients on ART. In brief, at facility level, the person in charge of CTC summarizes data from the registers monthly and quarterly to produce facility reports. These reports are used at the facility for improving and managing service provision. All care and treatment facilities in the district send a copy of monthly and quarterly summaries to the office of the district medical officer (DMO). At this level, facility reports are aggregated to form a district report for use at this level, and a copy of the report is sent to the regional level where aggregation is done to form a regional report. Copies of all regional reports are sent to NACP where information is aggregated to make a national-level report. A subset of health facilities that manage data electronically export data to the national level for analysis and validation of aggregate reports. To ensure quality of the captured data, health personnel at facility, district and regional levels, who are responsible for recording and reporting activities underwent training on the patient monitoring system. This was followed by supportive supervisory activities, involving district, regional and national-level supervisors. Supervisory activities at district and regional levels are done on quarterly basis, in conjunction with supervision of general health services, by Council Health Management Team (CHMT) and Regional Health Management Team (RHMT). Data analysis Facility data was analyzed to produce the following description information; types of facilities, availability of CD4 machines and reporting trends. The client’s data was analyzed to produce information regarding; age, sex, pregnancy status, TB status, number and proportion in care, number and proportion on ART, median CD4 count at start of ART treatment. Longitudinal data for patients on ART was analysed according to treatment outcome indicators over a period of time. Results By December 2007, a total of 210 health facilities were offering HIV/AIDS care and treatment services in the country (Table 1). The majority of these facilities are located in Dar-es-Salaam region 29 (13.8 %), followed by Iringa: 16 (7.2 %), Arusha 15 (7.1 %). Kilimanjaro and Mwanza each had 14 (6.7 %), while 13 facilities are located both in Mbeya and Morogoro (6.2 %). These seven regions have 53.9 % of all the facilities offering care and treatment of HIV /AIDS in the country. Rukwa region has the lowest number of facilities 4 (2%), (Table 1). Most, 147 (60.5%), of the facilities are owned by the government, followed by those owned by Faith Based Organisations (FBO), 63 (30 %) and private institutions, 20 (9.5 %). The analysis of the facilities according to levels show that majority 179 (85 %) are hospitals, followed by health centres 24 (12 %) and dispensaries 7 (3 %). Table 1: Number of CTC and estimated number and coverage of clients in need of HIV care and treatments by region, October 2004-December 2007
As of December 2007, the estimated number of people living with HIV infection in Mainland Tanzania was 2,636,785, of whom 123,147 (5 %) were enrolled in the HIV care programme (Table 1). Most of patients were enrolled in Dar es Salaam 18,784 (15.3%), followed by Iringa 14,607 (11.9 %), Mbeya 13,750 (11.2%), and Mwanza 12,548 (10.2%). These four regions enrolled 59,689 patients, which represents 48.5% of all patients (123,147) on HIV care and treatment. These regions are followed by Kilimanjaro, Tanga and Arusha. Regions in that order, while regions with least enrolees (<2%) include Pwani, Mara, Lindi, Kigoma and Manyara. Similarly as of December 2007, the cumulative number of AIDS cases was estimated to be 527,357, of whom 71, 439 (13.5 %) commenced ART (Table 1). The proportion of all estimated AIDS cases that actually commenced ART ranged from 4.8% in Rukwa to 30% in Arusha. Most (51.6%) of the 127,147 patients enrolled for care and treatment belonged to the 30-44 years age group. Females accounted for the majority (65.4 %), and the F:M ratio is 1.9:1.0. Significant sex differences in enrolment are first seen in the 15 to 19 years age group and increases further in age group 20-24, where the F:M ratio is 7:1. Among females, significant enrolment begins from age group 25-29 years, peaking at age group 30-34, whereas a decrease is seen from those aged over 40 years. At the lower ages (< 14 years) the number of registered clients was not different by sex, while above 65 years the number of males exceeded that of females, with F:M ratio of 0.8. Table 2: ART regimens prescribed to patients starting treatment in Tanzania
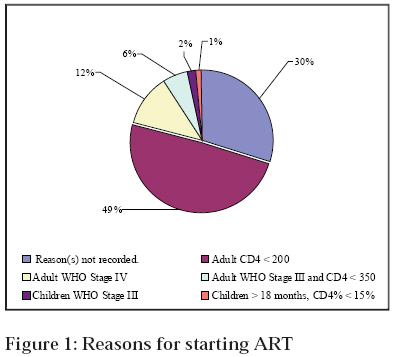
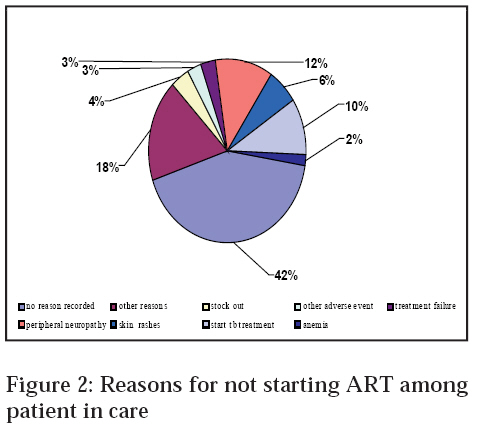
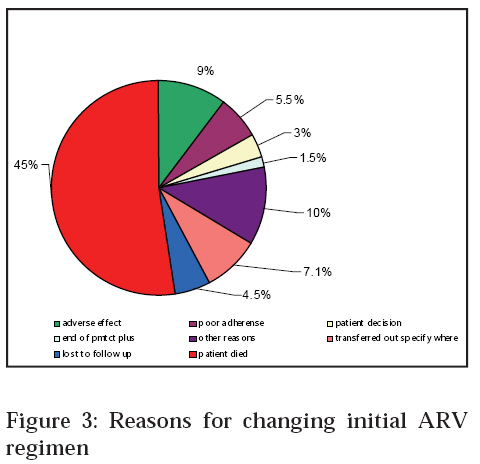
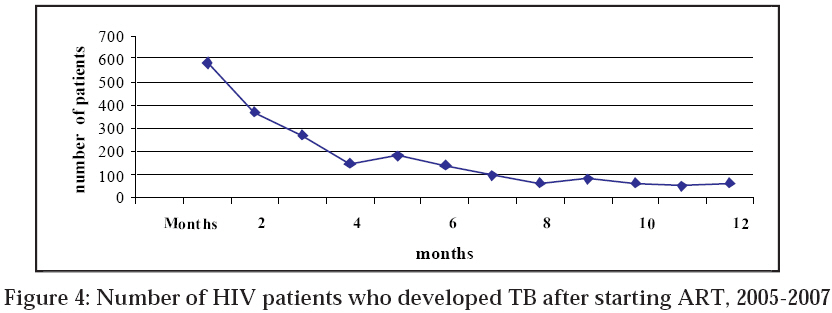
Of the patients enrolled in 2005 and followed for a period of 12 months, 10,193 (50.3%) patients made less than 6 visits to the facility, 5, 182 (25.5%) patients made 6 to 10 visits and 4,911 (24.2 %) patients made 11 or more visits, which could be regarded as poor, moderate and good attendance, respectively. Between 2004 and 2007, the total number of patients who commenced ART was 71,439, of which whom 44,176 (63.8%) were females. The number of patients on ART was 488 in 2004 and the number increased to 33,268 by 2006 and then decreased to 15,934 in 2007. Most of the patients on ART were aged between 20 and 59 years. The number of males starting ART was less compared to females, F:M ratio being 3:2. Sex difference became conspicuous from 20-24. However, sex differences were smaller in the younger age groups (0-19). Above 60 years the number of males on ART was higher compared to that of females. This distribution is consistent with that of all patient enrolled in care during the same period. Nearly half 25, 155 (49 %) of the patients were started ART due to low CD4 count (<200), while 6,367 (12 %) were adults in WHO stage IV category, 1,033(2 %) were children in WHO stage III category and in 15,191 (30 %) of the patients the reason(s) for starting ART were not recorded (Figure 1). Reasons for not starting ART are shown in Figure 2. These included; not fulfilling criteria according to national guidelines was the commonest reason accounting for 44, 695 (62 %), followed by ongoing counselling 19, 101(26 %). Other reasons included; awaiting laboratory results 5,757 (8 %), patient on TB treatment 791 (1%) or not yet willing to start 69 (0.01%). Most of the patients (87%) were on first line regimen. However, there were several drug combinations and dosages within initial ART regimen. Seven percent (5,006) of patients were on a second line ART regimen consisting mainly of ABC, ddl, LPV/r. Two percent of the patients were on other regimens (Table 2). A total of 6,618 on treatment had the initial ART regimen changed due to either patient developing peripheral neuropathy 812 (12%), starting anti TB medication 679 (10%) or severe skin rashes 378 (6%). Other reasons such as anaemia, treatment failure, nausea and vomiting accounted for 18% of all patients who changed. Remarkably, there was no recorded reason(s) for changing initial regimen in 2,653 (42%) of patients (Figure 3). The number of patients picking up drugs on schedule decreased with time being 100%, 32%, 22% and 6% at the start and at 6, 12 and 24 months after initiation of ART, respectively. Of the 2,314 patients who stopped ART, 1,042 (45%) had died, 165 (7.1%) were transferred out from initial facility, 128 (5.5 %) had poor adherence, 105 (4.5 %) were lost to follow up, 36 (1.5%) reached end of PMTCT plus, while for 324 (14 %) reasons were not recorded (Figure 4). Six cohorts of patients starting treatment between May and October 2005 were followed for 24 months to determine the proportion of them who were still alive and on ART at 6, 12 and 24 months after initiation of treatment (Table 3). In five out of the six cohorts the proportion of patients on ART who remained alive and on ART at 6, 12 and 24 months after initiation of treatment was 60%, 60% and 50%, respectively. The sixth cohort (October 2005) had a higher proportion (69%) of patients who were still alive after six months when compared with the other cohorts. Overall, the number of patients alive and on treatment after twenty-four months was similar for all cohorts, being around 53%. Between 2004 and 2007, 2,819 (4%) patients out of 69,250 eligible for ART, had TB before starting treatment. During the same period, a total of 3,084 patients developed TB after starting ART. Of these, 749 (24%) patients, 461 (15%) and 347 (11%) developed TB at the first, second and third month, respectively. The number of diagnosed TB cases among all patients on ART continued to decline to reach 97 (0.03%) cases after eight months of treatment (Figure 4). During the three years of the plan, the number of women who were pregnant at enrolment, in care and on ART was 1187, 558 and 330, respectively. Most of the women who were pregnant at enrolment were aged between 20-34 years, while those who got pregnant while on care and treatment were aged between 25 and 39 years. Discussion This paper is based on information which was available in the NACP data base as of December 2007. The limitations of this report include i) inconsistency and incomplete recording and reporting by some of the facilities and ii) a change in the reporting system in 2007 from patient level data to facility level monthly and quarterly summary reports, after a period of implementation of the earlier system, which caused disruptions in the recording and reporting during the transition period. Despite these drawbacks a number of achievements were recorded during the three years period including, an increase in: i) the number of health facilities providing HIV care and treatment from 32 in 2004 to 210 by the end of 2007, ii) geographical coverage of services from 6 regions in 2004 to 21 regions by end of 2007, iii) number of clients enrolled from 1,842 in 2004 to 123, 147 by end of 2007, and iv) increase in number of patients who commenced ART from 488 in 2004 to 69,250 by end of 2007. Furthermore, TB notification rate, for patients on ART, decreased from 1,082 per 100,000 after first month of treatment to reach 140 per 100,000 after 8 months of treatment, a rate that is comparable with that of the national TB notification rate (159 per 100,000) (WHO, 2006) . Despite these achievements the following observations are worth considering. First, the distribution of HIV care and treatment facilities in the country is not proportionate with regional population sizes. For example, Shinyanga with a population of 2,805,580 has only eight sites while Dar es Salaam with 2,497,940 has 29 sites. Likewise the percentage of patients on care and AIDS patients on ART show a wide range among the regions. For example, only 2% of people living with HIV in Shinyanga are enrolled in HIV care compared with 8% in Arusha. In addition, most of these facilities are based in regional and district hospitals located in urban areas, and relatively few are in rural areas where 77% of the population resides (URT, 2002). These differences should be addressed when selecting additional health facilities during expansion of the ART services in order to ensure equity in scaling up ART services in the country. Secondly, by the end of 2007 only 123,147 enrolees in the care and 71,439 on ART were captured in the national database, while data collected through telephone indicate that 263,717 were in care and 135,696 were on ART. This disparity is most probably due to lack of complete data at the national data base due to inconsistency in reporting by some facilities, and hinders assessment of set targets. We noted that most patients utilizing HIV care and treatment services are females, with the F: M ratio of ~ 2:1, while the national figures of HIV infection show a lower F:M ratio of 1.3:1 (TACAIDS, 2005) . The higher level of utilization of HIV care and treatment services by women may be due to either females having multiple entry points including antenatal care, having a higher prevalence of HIV as well as the known sex differences in health seeking behaviour (TACAIDS, 2005). A considerable number of patients on ART developed TB during the first three months of treatment, a phenomenon common in individuals starting ART in resource-limited settings (Johannessen et al., 2008) and has been associated with difficulties in diagnosing incipient or active TB at start of ART, among others due to limited culture facilities (Bakari et al., 2008; Matee et al., 2005; Mtei et al., 2005). The fact that a number of women were pregnant during enrolment in care, highlighting the need for strengthening of PMTCT services in order to reduce mother to child transmission of HIV infection (Kilewo et al., 2008). The number of patients alive and still on ART decreased significantly with time in a 24 months follow up from 100 % at baseline to 7 % of patients after 24 months. This may be due multiple factors ranging from patient factors e.g. seeking services from different facilities, erratic visits, to program factors such as inconsistent recording and reporting, drugs stock outs or insufficient capacity to deal with patient load. These factors need to be determined and evaluated, probably by conducting operational research and remedial action must be instituted as a matter of urgency. A 12- month follow up of patients on ART reveals that 75.8% had poor to moderate clinic visits. It was also noted that a number of patients visited more than one health facility seeking for care and treatment services. These observations may be due to a combination of reasons which may include patient factors such as accessibility, affordability (transport cost to the clinic), and clinic factors such as privacy/confidentiality, health care providers' attitudes, caring or professionalism and community factors such as lack of treatment support groups and stigma. Finally, there are several drug combinations listed as options for first line ART regimen and that there are several other ART regimens that are being prescribed, which are not listed in the National HIV treatment guidelines (URT, 2005). This situation calls for a stricter control and monitoring of ART prescriptions to avoid undue development of drug resistance, toxicity, drug interactions or other unwanted side effects. In conclusion, during the four years of implementation of HIV care and treatment services in Tanzania, there has been a number of achievements in terms of increased coverage, number of patients accessing services, staff capacity building and infrastructure of the health system. Despite these achievements, a number of challenges need to be addressed in order to continuously improve the quality of HIV care and treatment services in the country. These include: a) strengthen the recording and reporting system to ensure regular, complete and timely reports b) strengthen co-ordination of various stakeholders involved in patient monitoring c) training and retraining of staff involved in recording and reporting d) ensure regular supportive supervision at all levels e) conduct operational research in the area of HIV care and treatment and f) organise mid term evaluation of the recording and reporting system. Acknowledgements We wish to thank all health care workers who participated in enrolment, provision of HIV care and treatment services to the study participants and provision of the required patient and facility information. We acknowledge the contribution of Bertha Mussa, Victoria Martin and Flora Leornard of the National AIDS Control Programme for compiling data at the National level. We thank Yohana Mapala, Hellen Magige and Elaine for their assistance in analysis of the data. We also would like to recognise the contribution of Dr Bennet Fimbo and Dr Eric Van Praag for their valuable assistance in reviewing this manuscript. Lastly we do acknowledge, with special gratitude, the support that was provided by collaborating partners. References
Copyright 2009 - Tanzania Journal of Health Research The following images related to this document are available:Photo images[th09024f4.jpg] [th09024f1.jpg] [th09024f2.jpg] [th09024f3.jpg] |
| |||||||||