 |
| About Bioline | All Journals | Testimonials | Membership | News |
|
||||||
|
||||||
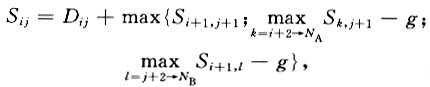
Tsinghua Science and Technology, Volume 6, Number 5, December 2001 pp. 397-400 Markov Model Applied to Gene Evolution JI Xinglai Department of Biological Sciences and Biotechnology, Institute of Bioinformatics, Tsinghua University, Beijing 100084, China Received: 2000-09-07 Code Number: ts01086 Abstract: The study of nucleotide substitution is very important both to our understanding of gene evolution and to reliable estimation of phylogenetic relationships. In this paper nucleotide substitution is assumed to be random and the Markov model is applied to the study of the evolution of genes. Then a non-linear optimization approach is proposed for estimating substitution in real sequences. This substitution is called the "Nucleotide State Transfer Matrix". One of the most important conclusions from this work is that gene sequence evolution conforms to the Markov process. Also, some theoretical evidences for random evolution are given from energy analysis of DNA replication. Key words: Markov process model; gene evolution; nucleotide substitution; nucleotide state transfer matrix; mutation drive; pairwise alignment With the development of molecular biology, the theory of evolution is being developed and changed, especially at the molecular level. The objective of this research was to try to understand the force behind sequence evolution and the rules of evolution. The development of bioinformatics has made it possible to study the sequences directly instead of relying on complicated experiments. In the end of the 1960s, Kimura and Ohta, and King and Jukes proposed the neutral theory of molecular evolution to explain non-Darwinian evolution at the molecular level. The neutral theory of molecular evolution accepts natural selection but doubts its crucial function on molecular evolution. It considers that molecular evolution is random and neutral, and that there must be some mutation pressure to sustain molecular evolution. Many patterns of nucleotide substitution have been suggested[1-8]. Unfor- tunately, these models are statistical, empirical and non-theoretical. This research using the neutral theory of molecular evolution tried to calculatethe speed of the gene sequence evolution as well as the thermodynamics of gene replication. Mutation was considered the leading factor of the molecular evolution and the Markov process model was applied to the two homologous sequences to obtain the state transfer matrix, which was theorized to be the speed of the gene sequence evolution. 1 Materials and Methods Selected from GenBank, 106 gene sequences were divided into 11 gene groups, including ATPase genes, etc. These genes were selected for their far-ranging existence in most species. In each group the homologous sequences were divided into several families by species. The homologous sequences were aligned by families using the Needleman-Wunsch algorithm along with a pairwise alignment programme. The Needleman-Wunsch algorithm is as follows:
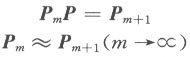
where Dij is the initial score, Sij is the accumulative score, and g is the penalty. Nucleotides were counted in the gene sequence state (gap as the fifth type accompanying with A, T, G, and C) to be optimized to obtain a rate matrix from each of the alignments. The approximation formula is:
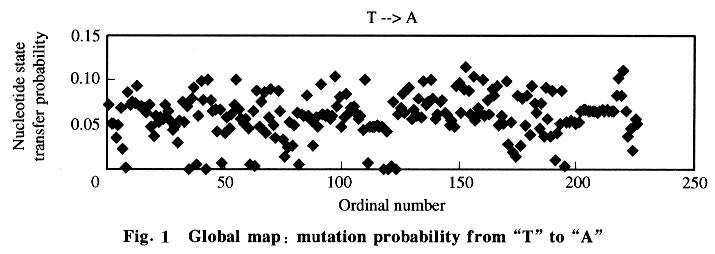
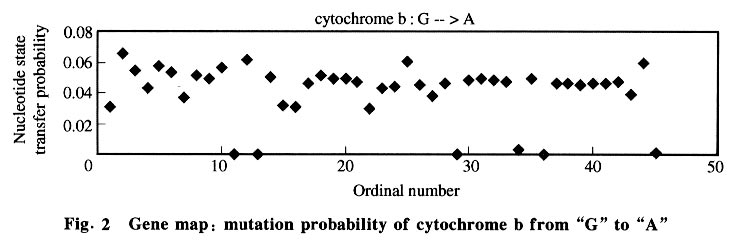
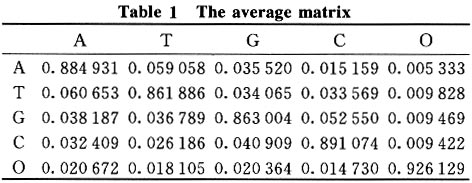
where m is the gene generation in its evolution, Pm is the sequence state, and P is the rate matrix. 2 Results and Discussion 2.1 Nucleotide state transfer matrix From the 106 sequences 226 alignments were made and used to optimize 226 rate matrixes. Data analysis was done using the 226 vector matrixes. The global map (Fig.1) was constructed first with the ordinal number as the X-coordinate and the nucleotide state transfer probability of each alignment (including all samples) as the Y-coordinate. 25 charts (each parameter in the matrix has its chart) were obtained. The global maps show that every nucleotide substitution was distributed in a certain range, so in the chart there appears to be a base line, which shows that the matrix was static although parts of the chart were not linear. Then gene maps and species maps were constructed. The gene map was constructed with the ordinal number as the X-coordinate and the nucleotide state transfer probability of each alignment (including only one gene group) as the Y-coordinate. Three gene groups (each group had 25 charts) were selected. The gene map (Fig.2) has better linearity, showing that there was a difference among gene groups in evolution. It also shows, indirectly, that in similar living conditions gene evolution follows a general rule that the Markov process model could simulate well. Finally, species maps were constructed with the ordinal number as the X-coordinate and the nucleotide state transfer probability of each alignment (including only the gene group of one class) as the Y-coordinate. The 7 gene groups were each divided into 4 classes (plant, vertebrate, mammal, and bacteria). Since gene evolution relates significantly to the gene environment, the same gene in different species had different evolution rules, seen in the global and gene maps by their staggered linearity. The species map had smoother linearity. 2.2 Mean and standard deviation The average value and standard deviation were calculated using the data with histograms constructed from the average values. The data and the histograms, show that the average matrixes for each series resembled one another, and the standard deviations were low enough (<0.02) to prove it in the means of mathematics. Thus, the data suggests that the matrix was static and the gene sequence carried out its evolution in terms of one inherent rule and one inherent speed (the nucleotide state transfer probability matrix). The average matrix was shown in Table 1. Patterns occurring in the matrix yielded the following possible rules.
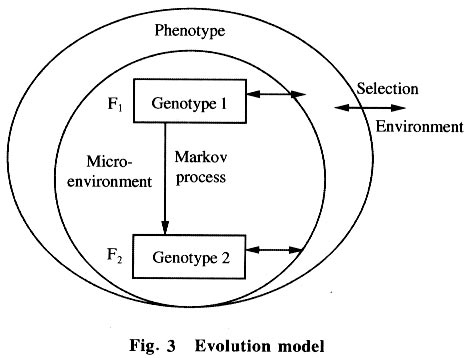
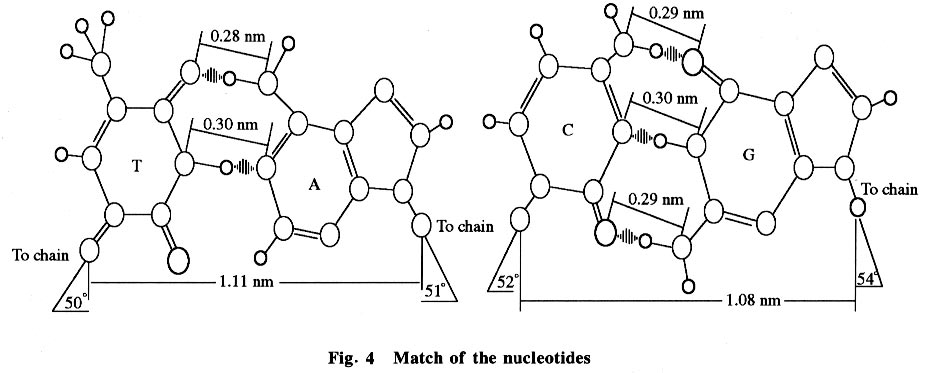
2.3 Markov process model When a real sequence is translated to a probability state using the Markov model, the sequence must be unified and transformed from nucleotides to a digital state with only the probability of the 5 existent states (A, T, G, C, and INDEL) of the sequence, where each probability parameter in the digital state which is a probability vector comes from the content of this existent state in the real sequence. Although each of the nucleotides in one existent state, such as the G state, has its own larruping micro-surrounding, all nucleotides were considered as one state when dealing with the sequence. Many biologists accept that evolution correlates with absolute time, but in fact much evidence points to the fact that it correlates with the numbers of sequence replication or the species procreation between parent and filial generations, because only in this process the sequence is able to mutate. With the calculations from the model, an absorbed state was obtained using the Markov transfer. This state is referred to as the metastable state. In real evolution, a real sequence would change to another one after a long time of mutation. Then finally there would be a new species. It could be imagined that when a metastable state comes into being, a new species appears and one evolutionary step finishes. 2.4 Evolution model and energy (thermodynamic) analysis An evolution model based on the Markov process would be very clear and reasonable (see Fig.3). Gene sequences live in a stable interior microenvironment, so they would change with a relatively unvarying speed. That is why the nucleotide state transfer matrix is relatively static. The outside surroundings could affect only the phenotype by natural selection, or affect indirectly the gene evolution and select the result of evolution. Gene sequence mutation following the Markov process is the intrinsic factor of evolution while the outside environment helps to select the evolution. The phenotype is the bridge between the genotype and its environment. What drives the mutation (evolution)? It was considered that there is a certain probability of mis-matches in nucleotide replication that leads to sequence mutations, which leads to gene sequence evolution. It was also considered that this certain probability was maintained by the chymic dynamic factor or the energy factor of the nucleotide couple, because only at this time could the sequence have been altered. It is known that A couples with T and G couples with C conforms mostly by the energy optimization of H-bonds and space location resistance (see Fig. 4). Thus there is a low probability that other matches would take place and the potential energy shift of every nucleotide match could be calculated by the predigested reaction: dN1TP + dN2MP -> dN1MP : dN2MP + PiPi. It is proposed that the energy factor of nucleotide coupling maintains the inheritance and variation. It is known that A couples with T and G couples with C because in this condition the potential energy of the system drops to the minimum, so these couples are the best preference and the filial sequences maintain consistency with the parent sequence. However, it is not to say that A could not couple with G or others, because when A couples with G or others the potential energy also drops. Although those couples (mis-matches) occur rarely, according to dynamic calculation, they take place with a certain probability which leads to mutation, and then, to evolution. 2.5 Significance of the matrix The matrix could be used as the original score matrix for alignment to align different real sequences again and again in order to optimize the matrix and alignment until the matrix is astringed and the best alignment is obtained. According to Eq.(1), phylogenetic trees could be constructed by calculating the parameter m The matrix would facilitate discussion about the drive, speed, development and so many other aspects of evolution, and possibly be used to control evolution in the future. 3 Conclusions The environment has little effect on gene sequence evolution and there is an intrinsic drive to force the progress of evolution. This intrinsic drive is maintained by permanent mis-matches which are the result of the dynamic chemical factors of nucleotide coupling in replication. These mis-matches lead to sequence alteration which leads to evolution. References
Copyright 2001 - Tsinghua Science and Technology The following images related to this document are available:Photo images[ts01086f3.jpg] [ts01086f2.jpg] [ts01086f1.jpg] [ts01086t1.jpg] [ts01086f4.jpg] |
| |||||||||