 |
| About Bioline | All Journals | Testimonials | Membership | News |
|
||||||
|
||||||
Tsinghua Science and Technology, Volume 6, Number 5, December 2001 pp. 401-405 Different Modes of the Effect of 1,2-Propanediol and Azone on Stratum Corneum Lipids WANG Hongwu State Key Laboratory of Biomembrane and Membrane Biotechnology,
Department of Biological Sciences and Biotechnology, Tsinghua University, Beijing
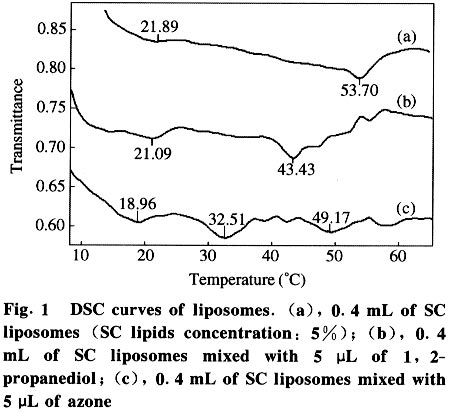
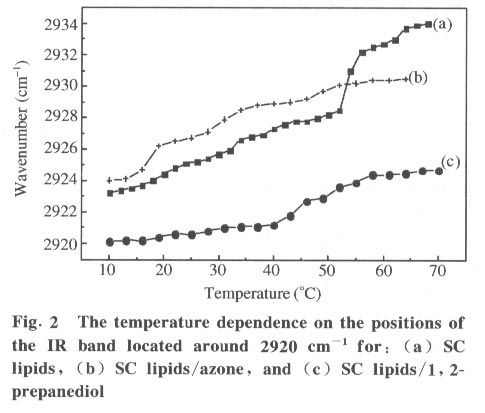
100084 China Received: 2000-09-08 Code Number: ts01087 Abstract: The stratum corneum (SC) controls the diffusion and penetration of drugs into and through the skin. In this investigation, differential scanning calorimetry (DSC) and Fourier transform infrared spectroscopy (FTIR) were used to study the effect of two enhancers, 1,2-propanediol and azone, on lipids extracted from SC (SC lipids). The two enhancers affected the SC lipids. However, their function modes were different. The penetration enhancing mechanisms of the two enhancers are discussed based on their effects on SC lipids and on their efficiencies in arbutin permeation enhancement Key words: stratum corneum (SC); permeation; 1,2-propanediol ; azone; Fourier transform infrared spectroscopy (FTIR); differential scanning calorimetry (DSC) Introduction The use of chemical enhancers is an effective method for promoting drug diffusion and penetration into and through the skin. The function of different enhancers is based upon different mechanisms. For some enhancers, the function may be dependent on several mechanisms[1]. However, the connection between the characteristics of the enhancer and the mechanism and the principles for enhancer screening are not very clear. The stratum corneum(SC) is the main barrier of the skin. Studying the interaction between enhancers and SC lipids is an effective way to determine their mechanisms of permeation enhancement. DSC and FTIR were used to study the effects of two different enhancers on the structure of SC lipids. The connection between the characteristics of the enhancers and their permeation enhancement mechanisms were studied. p-Arbutin is a glycosylated hydroquinone found at high concentrations in certain plants capable of surviving extreme and sustained dehydration[2]. It can inhibit the activity of tyrosinase and can be used as a food preservative. In this investigation, arbutin was used as a model of a soluble polar drug. 1 Materials and Methods 1.1 Chemicals, instruments and facilities Dodecyl-aza-cycloheptanone-2 (Azone) was purchased from Beijing Donghuan Chemicals. 1,2-Propanediol was purchased from Beijing Fuxing Chemicals. All other chemicals were of analytical grade. A diffusion cell was constructed for the permeation experiment. This equipment was composed of donor and acceptor chambers separated by an SC membrane. The acceptor chamber volume was 4 mL and the chamber was equipped with a magnetic stirrer. The PBS buffer (pH 7.4) was used as the medium. Fluorescence spectra were recorded with a Hitachi M850 fluorescence spectrophotometer. DSC measurement was performed with a Sataram micro DSC III differential scanning calorimeter. IR spectra were recorded with a PE Paragon 1000 FTIR spectrometer equipped with a TGS detector. 1.2 Sample preparation 1.2.1 Permeation experiment To decrease the gradual oxidation of arbutin in the oxygen containing solution, the PBS buffer (pH 7.4) used for the arbutin solution was vacuum degassed to remove the oxygen and then purged with nitrogen. This treatment was repeated three times. Arbutin was dissolved in the treated PBS buffer to obtain the arbutin solution. Fresh porcine dorsal skin was obtained from a half year old healthy pig after surgical resection. The stratum corneum was separated from the skin as by Tiemessen et al.[3] The SC pieces were then examined under a microscope (x1000) to choose intact pieces of stratum corneum. The SC film isolated from the porcine skin was cut into pieces 2 mm x 2 mm. The lipid was extracted with the cyclohexane/ethanol (2 : 8) mixture in a flask for 24 h at 4°C with continuous magnetic stirring. The extracts were centrifuged at 1 000 g for 20 min. The organic solvent was removed from the supernatant with nitrogen. The residual solvent was vacuum removed for 2 h and the SC lipids were kept below 0 °C until use. SC film isolated from porcine skin was clamped between the 2 chambers in such a way that the exterior surface of the SC faced the receptor chamber. The assembly was tight enough to avoid any leakage. Four millilitres of the pretreated PBS buffer was put into the acceptor chamber. The system was maintained for 30 min to make sure that the SC film had no leakage. Then, 0.1 mL of the mixture of arbutin and a drug delivery suspension was put in the donor chamber. The solution in the acceptor was magnetically stirred for 24 h at room temperature. 1.2.2 Arbutin measurement After 24 h, 3 mL of the solution in the acceptor chamber was taken out and centrifuged at 10 000 g for 40 min at room temperature. The top supernatant was used to do the fluorescent measurement. Fluorescence intensities at lem =321 nm (lex =257 nm), F321 , were collected from arbutin solutions of different concentrations and the calibration curve of arbutin concentration was obtained. The arbutin concentration and quantity in each sample was determined according to the fluorescence intensity and the calibration curve. A permeation experiment on at least two samples was performed for each group. If DF321 , the fluorescence intensity difference between the two samples, was less than 2, the average of the two measurements was taken as the final result for the group. If DF321 >2, the SC film was believed to be degraded and further measurements were taken until a satisfactory result was obtained. 1.2.3 FTIR study of SC liposomes treated with enhancers SC liposomes were prepared according to the conventional method using a pretreated PBS buffer. The lipids concentration was 5%. 1,2-Propanediol and azone were added to the SC liposomes. The mixture was stored at room temperature for 1 h before measurement. The volume ratio of enhancer to liposomes was 1 : 40. The sample was placed between two CaF2 plates and sealed carefully to prevent water evaporation during measurements. FTIR spectra of the samples were collected every 3 °C between 10 - 70 °C. The sample temperature was maintained for 15 min before each measurement. 16 scans were recorded at a resolution of 2 cm-1 . At each temperature, the buffer or enhancer/buffer mixture spectrum was measured as background and subtracted from the corresponding spectrum of liposomes to obtain the final spectrum of SC liposomes. Positions of the IR band around 2920 cm-1 were read and the temperature dependent curve of the peak position was determined. 1.2.4 DSC measurement Liposomes used for DSC measurement were prepared as above. The lipid concentration was 1% (w/w). The enhancer was mixed with the SC liposomes and held for 1 h before scanning. 2 Results and Discussion The permeation experiment results are listed in Table 1. It was shown that both 1,2-propanediol and azone increased the arbutin permeation efficiency. Figure 1 gives the DSC curves of SC liposomes and SC liposomes mixed with 1,2- propanediol and azone. SC lipids consist mainly of type 1 - 6 ceramide (50%), cholesterol (25%) and some saturated fatty acids (10% - 15%) . Because of the interaction between different lipids in SC, the DSC peaks of SC lipids are not as sharp as the DSC peak observed in the single lipid component. It has been reported that SC lipids give two DSC peaks[4 - 6]. Our results: in curve (a), the larger and sharper peak located around 50 - 60 °Cis the main transition peak which can be ascribed to the solid-to-liquid phase transition of the ceramides[7]. The smaller low-energy peak (18 - 24 °C) in curve (a) can be attributed to the orthorhombic to hexagonal transition of the lipid chain packing[8]. More peaks appeared in curve (b) and (c) than in curve (a). Because of the difficulty in identifying the attributes of all these peaks, only the peaks with larger peak areas were analyzed. In curve (b), the largest peak was located at 43 °Crather than 54 °C . In curve (c), one larger peak was located around 49 °C instead of 54 °C, and another one was located around 19 °C rather than 22 °C. In addition, a new and largest peak appeared around 33 °C. This peak may be attributed to some other component in SC reacting with azone. The absorption band at 2920 cm-1 and the band at 2850 cm-1 in the IR spectrum of lipids can be attributed to the CH2 asymmetric stretching and the symmetric stretching, respectively[9]. The positions of the two bands shifted to higher wavenumber with increasing number of gauche conformers in the acyl chains. The increase in the number of gauche conformers suggests increasing molecular fluidity and disordering[9]. Therefore, these two band positions yielded structural information about membrane lipids. Figure 2 shows the temperature profiles of the positions of the IR band located around 2920 cm-1 for SC lipids (curve (a)), SC lipids/azone (curve (b)), and SC lipids/1,2-prepanediol (curve (c)). Increase in temperature induced a blue shift in the position of the band located at about 2920 cm-1 for the IR spectrum of SC lipids (curve (a)). The slope of the curve was larger within the temperature range of 50 - 60 °C than within other temperature ranges, which means that there was an abrupt band position shift within this range of temperature. The temperature range was in agreement with the transition temperature obtained from the corresponding DSC curve. However, there was no obvious change in the slope of curve (a) in Fig.2 corresponding to the transition peak around 22 °C of the DSC curve. This suggests that the orthorhombic to hexagonal transition of the lipid chain packing induced no great increase in the number of gauche conformers. Curve (c) in Fig. 2 shows that the position of the IR band around 2920 cm-1 for the SC lipids mixed with 1,2-propanediol was temperature dependent. The curve slope increased from 40 to 60 °C. This suggests that there was a phase transition within this range of temperatures for SC lipids mixed with 1,2-propanediol . The temperature dropped about 10 °C lower than in the control. This agrees with the DSC result. Similarly, curve (b) shows a slope increase within the temperature ranges of 15 - 18 °C, 28 - 34 °C and 42-50 °C corresponding well to the DSC results obtained from SC lipids mixed with azone. The IR and DSC results demonstrate jointly that both 1,2-propanediol and azone decreased the phase transition temperatures of SC lipids, especially for ceramides. Within the whole temperature range of measurement, the position of the IR band around 2920 cm-1 of the SC lipids/1,2-propanediol mixture was lower than that of the control for about 4 cm-1 ( Fig.2 ). However, the corresponding position for SC lipids/azone was higher than that of the control for 1 - 4 cm-1 from 10 to 52 °C. This position was related to the number of gauche conformers presented in the acyl chains of the membrane lipid molecules. This suggests that the two enhancers were different in their modes of reaction with SC lipids. It is widely accepted that there are two possible pathways for drug penetration through SC. One is the intercellular route for non-polar drugs. Another is the transcellular route for polar drugs[10]. The role of SC in the barrier function of the skin is dependent not only on the special lipid mortar structure but also on the protein brick structure[11,12]. In this investigation, DSC and FTIR were used to study reactions of enhancers with SC lipids. According to the above hypothesis, the reaction should affect mainly the intercellular route. Barry[10] believed that the penetration enhancing function of 1,2-propanediol was dependent upon its ability to dissolve the a-keratin in SC, occupy the hydrogen bonding site, make the protein structure less compact, and therefore, facilitate drug diffusion in the transcellular route. He suggested that 1,2-propanediol does not react with SC lipids. However, our result demonstrates that 1,2-propanediol affected SC lipids. This suggests that 1,2-propanediol can affect not only the transcellular route but also the intercellular route. The presence of 1,2-propanediol decreased the temperature for the solid-to-liquid phase transition of ceramides in SC lipids, but either the room temperature under which the permeation experiment was carried out or the human body temperature was below the phase transition temperature. On the other hand, the position of the IR band located at about 2920 cm-1 of the SC lipid/ 1,2-propanediol mixture was about 4 cm-1 lower than that of the untreated SC lipids within the temperature range of the measurement. Therefore, it is supposed that 1,2-propanediol decreased the SC lipids fluidity on the whole and limited the arbutin diffusion along the intercellular route. Since the result of the permeation experiment showed 1,2-propanediol promoted the SC penetration of arbutin, the reasonable conclusion was that the penetration enhancing effect of 1,2-propanediol was mainly on the transcellular route. It is reported that the skin penetration enhancing effect of azone is based upon the fact that azone can increase the fluidity of SC lipids[10]. Results from this research offer new support for this suggestion. Azone not only decreased the two phase transition temperatures for the SC lipids but also increased the fluidity of the SC membrane within the temperature range including room temperature and human body temperature. This indicated that azone strongly affected SC lipids and therefore affected the intercellular route in SC. Above 52 °C, the wavenumber of the IR band located at about 2920 cm-1 for the SC lipisome/azone mixture was lower than that for the SC liposomes without azone. Further study is needed to explain this result. Arbutin, the model drug used in this study, was a soluble polar molecule. According to the widely accepted hypothesis mentioned above, arbutin should diffuse mainly along the transcellular route in SC. The development of its enhancer should be focused on the transcellular route unblocking. However, our results suggest that the two enhancers, which were efficient in arbutin permeation enhancement, did affect the SC lipids structure and therefore affected the intercellular route in SC although the reaction modes of the two enhancers were different. In conclusion, to develop the skin penetration enhancer of polar drugs, not only the transcellular, but also the intercellular route should be considered. Within the temperature range from 10 °C to 50 °C, the IR absorbance peak of SC liposomes/azone, curve (b) in Fig.2, had higher frequencies than those of the control sample, curve (a) in Fig.2 , at all of the corresponding temperatures. The frequency of the band maximum was sensitive to the static order of the acyl chain. Therefore, shift of these peaks to higher frequencies was believed to be caused by the partitional increase of gauche conformers and disordering degree of the liposomes bilayer. The existence of azone could disturb the arrangement of lipid molecules in SC. The increase of molecular disorder within the SC lipids facilitated the p-arbutin migration in the intercellular route. References
Copyright 2001 - Tsinghua Science and Technology The following images related to this document are available:Photo images[ts01087f2.jpg] [ts01087f1.jpg] |
| |||||||||