 |
| About Bioline | All Journals | Testimonials | Membership | News |
|
||||||
|
||||||
Tsinghua Science and Technology, December 2001, 6(5), pp. 417-420 Quantitative Fluorimetric Analysis of Plant Nicotinamide* WANG Zebin Department of Biological Sciences and Biotechnology, Tsinghua University, Beijing 100084, China * Supported by the National Natural Science Foundation of China (No.39780030),
the International Foundation for Science (No.C/1992-1), and Fund of the Ministry
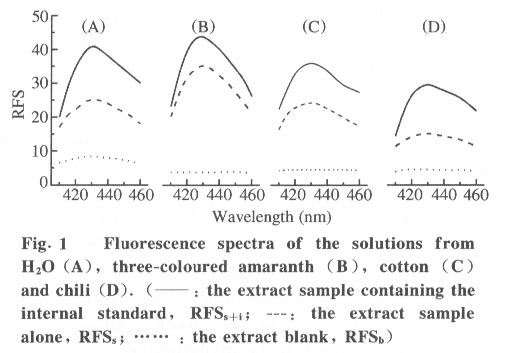
of Education. Received: 2000-12-27 Code Number: ts01090 Abstract: Fluorimetry was used to measure the amount of nicotinamide in plant samples. The nicotinamide was extracted and purified from plant tissues with ethyl acetate; converted to the fluorescent derivative, N1-methylnicotinamide, by reacting with methyl iodide; and quantified according to its fluorescent strength. The nicotinamide in the leaf tissue of ten kinds of plants was measured, and the results showed that the nicotinamide content for different plants varied from 0.1 to 3.0 mg/g of fresh leaf weight. In addition, the crossing value of the fluorescent strength and the nicotinamide amount demonstrated that the linear correlation coefficient generally reached 0.997, with a detectable limit of 0.02 mg/L and the relative standard deviation of less than 9%. The results suggested that this method of quantifying nicotinamide in plants is useful and beneficial for functional research. Key words: plant nicotinamide; quantitative detection; fluorimetric method Introduction Nicotinamide (NIC), also called vitamin B3 or vitamin pp, functions as a plant growth factor to increase the dry weight of plants and fresh fruit through improving photosynthesis, stimulating CO2 absorption, and restraining respiration[1 - 3]. Furthermore, recent research reported that NIC in plants might be related to their defense mechanisms. There was an increase in the activity of phenylaniline ammonialyase (PAL) and chalcore synthase (CHS) in plants treated with NIC, while PAL was one of the critical enzymes in phenylalanine and flavonoid pathways which included many key substances involved in defense mechanisms [4]. On the other hand, strand breakage in DNA, caused by various stresses such as oxidative stress, treatments with various mutagens or UV light, could activate in vivo poly(ADP-ribose)polymerase (PARP), which degraded nicotinamide adenine dinucleotide (NAD) to produce polymers of ADP-ribose by releasing NIC. When NIC exceeded certain threshold amounts, it then reduced the activity of PARP stabilizing NIC content in plants[5,6]. However, little is known about the action mechanism of NIC in plants. To investigate NIC's action mechanism, it was first necessary to find a suitable assay system to quantify the plant NIC. NIC quantifications in animal tissues have been done[7 - 10], but almost all of these used methods such as polarography[7], chromatography[8], and high pressure liquid chromatograph (HPLC)[9], could not be applied to quantification of plant NIC due to the low sensitivity and selectivity of the methods or due to the low NIC content and the complicated components in plant tissues. Although highly sensitive and selective, radioassay[10] required considerable time and effort, and had the safety and economic shortcomings making it difficult to be used for plant NIC quantification. The fluorimetric method developed for serum NIC analysis by Clark[11] was fast, accurate and safe for quantifying plant NIC, and therefore, was used for this work. NIC, as well as its derivative nicotinic acid, did not fluoresce under UV irradiation. Since there were a pyridyl and amido groups in NIC molecules, the N1-alkyl-pyridinium derivative, N1-methyl- nicotinamide fluoresced under the ultraviolet to allow the quantification of plant NIC by a spectrophoto-fluorometer. In this paper, a fluorescent quantitative assay system[11] was applied and the NIC of leaf tissues in ten kinds of plants was determined. This appears to be the first application of fluorescent quantification of plant NIC. 1 Methods and Materials 1.1 Plants The plants used in this study were eggplant ( Solanum melongena ), chili ( Capsicum frutescans ), kangkong ( Ipomea aquatica ), lettuce ( Lactuca sativa ), three-coloured amaranth ( Amaranthus tricolor ), rape ( Brassica napus ), cabbage ( Brassica oleracea var capitatas ), tomato ( Lycopersicon esculentum ), spinach ( Spinacia oleracea ), and cotton ( Gossypium herbaceum ). Young leaves from mature plants grown in fields were used for the NIC extraction. 1.2 Chemicals Purified NIC was purchased from Sigma, all other chemicals were domestic of analytical grade. 1.3 Preparation of NIC According to Berflund's method[12], 5.0 g fresh leaves were completely homogenized with silicon dioxide using a mortar and pestle, and extracted with 5 mL of boiling H2O. After being centrifuged at 7000 r/min for 5 min, the residue was re-extracted twice with the same volume of boiling water and the combined water solution was centrifuged at 7000 r/min for 10 min. The resulting supernatants were adjusted to the volume of 20 mL with H2O and used in the next step to isolate the plant NIC. In order to isolate the NIC from the extracted water solution, the method described by Clark[11] was modified. 300 mg NaCl and 0.25 mL of 0.3 mol/L HCl were added to 0.5 mL aliquot of the aqueous supernatant, which were stirred on a Vortex mixer until the NaCl dissolved. The resultant saturated NaCl solution was then washed twice with 10 mL water-saturated ethyl acetate. The combined water phase was added by 0.25 mL of NaCl-saturated 0.75 mol/L Na2HPO4 and extracted with 10 mL dry ethyl acetate. The 1 mL resultant ethyl acetate phase containing NIC was transferred to an Eppendorf tube, and the ethyl acetate was evaporated overnight in a water-aspirated vacuum desiccator until it was dry. The dried NIC samples were analyzed fluorimetrically for N1-methylnicotinamide as presented below. 1.4 Fluorimetric assay The dried NIC sample was dissolved in 0.5 mL methyl iodide and stirred until it was completely dissolved. Then, the solution was placed in the dark for 24-30 hours. After evaporation of the methyl iodide in the chemical hood, 0.1 mL of 10% acetophenone in 80% ethanol was added. After being completely mixed, 0.1 mL of 1.0 mol/L KOH in 80% ethanol was added and stirred immediately. Exactly 8 min after the addition of alcoholic KOH, 1.0 mL of 99% formic acid was added and mixed immediately to terminate the reaction. The order of reagent addition was reversed for the tube serving as an extract blank. Thus, to each blank, 1.0 mL of 99% formic acid was added first, followed by the addition of 0.1 mL of 1.0 mol/L KOH in 80% ethanol and then, after mixing, 0.1 mL of 10% acetophenone in 80% ethanol. After standing for 4 - 6 hours, the resulting solution was measured at an emission wavelength of 430 nm and an excitation wavelength of 370 nm on a spectrophoto- fluorometer (Hitachi-850). A series of standard solutions containing nicotinamide was prepared in 0.1 mmol/L aqueous HCl and processed as described above. A pre-determined amount of the solution's ethyl acetate phase was added to the same phase of the extract sample as an internal standard. 2 Results and Discussion 2.1 Application of the fluorimetric method to plant NIC quantification The method for quantifying NIC from serum described by Clark[11] was partially modified and used to isolate NIC from plant leaves. After being converted to its fluorescent derivative, the plant NIC from fresh tissue was quantified using a spectrophotofluorometer. Using Clark's method, water-saturated ethyl acetate was used to extract methyl iodide before adding acetophenone. In this step, some of the NIC in the water phase was lost, followed by discard of the organic layer, increasing some unavoidable error. The accuracy of the results would have been better if this step had been omitted. After extracting NIC from the aqueous solution with ethyl acetate, only 1 mL of the methyl acetate phase was desiccated in the next step. If the NIC content was high enough, a small volume was used to decrease the evaporation time. When the NIC content was low, the volume of the solution needed to be greater for satisfactory results. Since the sample impurities might have diminished the fluorescent strength and the compositions of extracts from different plants were different, relative fluorescent strength (RFS) produced by the same amount of NIC in different samples varied. The RFS for the same amounts of the internal standard in H2O, three-coloured amaranth, cotton and chili were 16.5, 8.5, 12.0, and 14.6, respectively, with a standard deviation of less than 5% (Fig. 1). The different RFS values for the extract sample containing the internal standard and for the extract sample were considered as resulting from the internal standard in that sample. Similarly, the different RFS values for the extract sample and the extract blank resulted from the authentic NIC of that extract sample. The ratio of the internal standard to the undetermined NIC should have been equal to that of the RFS produced by both. Thus, the NIC was reversely quantified according to its fluorescent strength.
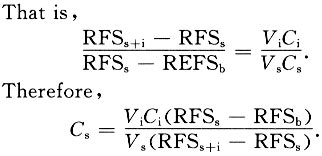
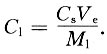
Here RFSs+i is the RFS of the extract sample containing the internal standard; RFSs is the RFS of the extract sample; RFSb is the RFS of the blank; C s is the NIC concentration of the extract sample (mg/L); C i is the NIC concentration of the internal standard added (mg/L); V s is the volume of the extract sample treated (L); V i is the volume of the internal standard added (L). While NIC content in a leaf was calculated using the following equation
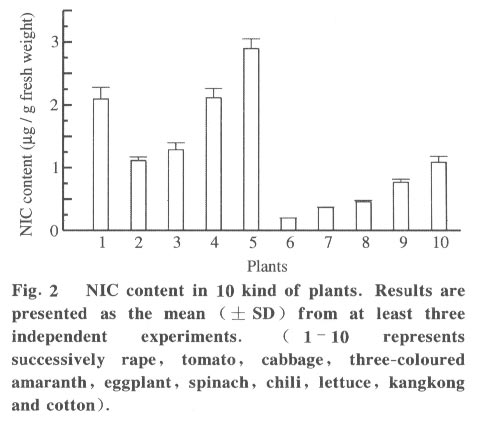
Here Cl is the NIC content of the leaf, (mg/g) ; M l is the weight of the leaf (g); and V e is the volume of the extract sample (L). The NIC contents for three-coloured amaranth, cotton and chili were 2.12, 1.09 and 0.36 mg/g , respectively. After each standard solution of 0 - 0.1 mg/L was obtained as the procedures described in the methods section, a standard curve was made. The linear relative coefficient was 0.997, the relative standard deviation was less than 9% and the detectable limit was 0.02 mg/L . The results demonstrated that the amounts of NIC in plant tissues could be quantified using this fluorimetric method. 2.2 NIC contents in 10 kinds of plants NIC contents in 10 kinds of plant leaves was quantified using this method. As shown in Fig. 2, the NIC content in different plants varied from approximately 0.1 to 3.0 mg/g of fresh leaf weight. The NIC content in eggplant leaves was 2.9 mg/g, while that in spinach leaves was only 0.19 mg/g . The NIC content in eggplant leaves was approximately 15 times greater than that in spinach leaves. The results showed that plant NIC could be quantified quickly, accurately and safely using the fluorimetric method. Compared to other methods, this method had the following advantages. First, it was convenient, fast and could simultaneously treat many samples. Secondly, it was economical, costing only 1% of the cost of radioassay. Thirdly, it produced no radioactive pollution. Although the sensitivity may have been lower than that of the radioactive method, it still satisfactorily quantified plant NIC. In this study, the NIC content in only young leaves of ten kinds of mature plants were studied. The NIC content in different tissues, at different stages of growth and under different growth conditions also needs to be measured. In addition, plant NIC defense mechanisms remain to be investigated. References
Copyright 2001 - Tsinghua Science and Technology The following images related to this document are available:Photo images[ts01090f2.jpg] [ts01090f1.jpg] |
| |||||||||
