 |
| About Bioline | All Journals | Testimonials | Membership | News |
|
||||||
|
||||||
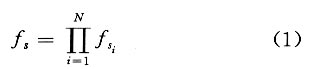
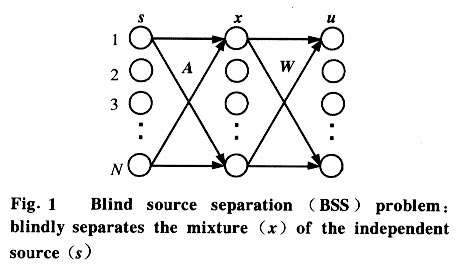
Tsinghua Science and Technology, December 2001, 6(5), pp. 503-508 Single-Trial Estimation and Analysis of PVEP Based on Independent Component Analysis* HONG Bo Department of Electrical Engineering, Tsinghua University, Beijing 100084, China; Beijing Friendship Hospital, Beijing 100050, China * Supported by the National Natural Science Foundation of China (No. 59937160) Received: 2000-06-20 Code Number: ts01106 Abstract: A novel method based on the extended infomax approach of independent component analysis (ICA) is proposed for the single-trial estimation of multi-channel pattern-reversal visual evoked potential (PVEP). The clinical applications illustrate the encouraging performance of the method. The number of trials needed is reduced to 3, but the estimated VEP complex is clearer than that obtained by conventional ensemble averaging with 50 trials. By analyzing the time course and spatial pattern of the independent components (ICs) of the multi-channel PVEP, one component is found to be reasonably related to the P100 peak. Key words: independent component analysis; pattern-reversal visual evoked potential (PVEP); single trial estimation; P100 peak Introduction Pattern-reversal visual evoked potential (PVEP) is widely used in clinical diagnosis and surgery, because it can reflect the result of the visual process consisting of light perception at the retinal, transmittance along the visual pathways, and the final cortical presentation. In practice, the PVEP is a transient signal contaminated by the ongoing background electroencephalograph (EEG) and other noises with poor signal to noise ratio. To obtain a clear PVEP complex, the ensemble averaging method is commonly used with a large number of trials. However, the PVEP signal can not be considered as a deterministic process since its components are known to vary both in amplitude and latency from stimulation to stimulation[1], so the ensemble averaging approach may lead to the loss of dynamic information. In addition, the number of trials should be reduced in clinical situations to avoid fatigue and accommodation of the patient's visual system. For these reasons, many efforts have been contributed to the development of single-trial estimation techniques including adaptive filtering[2], wavelet denoising[3], and neural network filtering[3,4]. Recently, blind source separation by independent component analysis (ICA) has received much attention because of its potential applications in biomedical signal processing such as electrocardiograph (ECG)[5], electroencephalo- graph (EEG)[6 - 8]and functional MRI (fMRI)[9]. The goal of ICA is to recover independent sources from observations that are unknown linear mixtures of the unobserved independent source signals[10]. Neurophysiological studies have shown that the evoked potential is generated in conjunction with synchronous activity in pyramidal cells in the activated cortical area (the source) and the volume conduction through the cerebrospinal fluid, skull and scalp is thought to be linear. Therefore, ICA can be utilized to get a better view of the electric activities in the brain by demixing the measured scalp EEG into its statistically independent components. More precisely, ICA decomposes the PVEP recorded by multiple electrodes on the scalp into a sum of components with fixed spatial distributions and sparsely activated, maximally independent time courses, without attempting to directly specify where in the brain these activities were generated. In the present study, the ICA based method was first applied to the enhancement and analysis of multi-channel PVEPs. A novel method based on the optimal selection of independent components (ICs) was utilized to get a clear estimate of the PVEP complex in a single trial. In the clinical application, the proposed method was shown to give better performance than the ensemble-averaging method. In addition, the single-trial approach of PVEP estimation allowed us to investigate the dynamic change of NPN complex of VEP from trial to trial. The spatial pattern embedded in the demixing matrix derived by ICA may also help us determine the ICs that have possible physiological meaning. 1 Method 1.1 Independent component analysis The ICA idea is closely related with the problem of blind source separation (BSS). A vector of independent sources s(t)=[s1 (t),...,sn(t)]T propagates through a medium and mixtures of them are picked up by n sensors. The observed vector is denoted as x=As, where A is a square matrix. The BSS problem is to identify the matrix A, or to find a matrix W such that u=Wx=WAs is an estimate of the source signal s (the entries of vector u may be permuted and rescaled versions of the entries of s) (Fig. 1). Since the sources sj(t), j=1,2,...,N are independent of each other, the joint probability density function (p.d.f.) of s is the product of the marginal p.d.f. of each component:
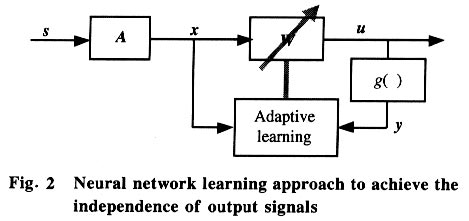
Independence means the absence of all higher order statistical moments between the components. The requirement is stricter than that of the principle component analysis (PCA) in which only second-order correlation is removed. There are two ways to achieve the independence between signals. One is to evaluate all the statistical higher order moments and try to eliminate them, which is called the cumulant-based method. The other is to apply the nonlinear squashing function to produce the necessary higher order statistics through its Taylor series expansion. Considering the computational efficiency, the later approach is more convenient to apply than the former one. In most cases, the neural network learning approach is used to optimize the objective function that implies the independence between signals. In this framework (Fig. 2), each output component uj is fed to a nonlinear function gj( ) which was used to approximate the calculation of the higher order cumulant. It can be proved that the ideal form of gj( ) is the cumulative density function (c.d.f.) of the distributions of the independent sources sj. However, many authors have found in their work that the choice of the nonlinear function gj( ) is not very critical[11,12]. For example, the Sigmoid or Tanh functions may serve as good candidates for gj( ) when the sources have super-Gaussian distribution. In the framework illustrated in Fig. 2, Bell and Sejnowski used the sigmoid function to derive the stochastic gradient learning rules for maximization of the mutual information between the input x and the nonlinear output yof a neural network, which leads to the independence between the linear outputs ui. The learning rule can be expressed as:
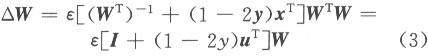
where e is the learning rate. This information theoretic approach is commonly called infomax ICA algorithm. By applying the concept of natural gradient[12], the learning rule can be modified as:
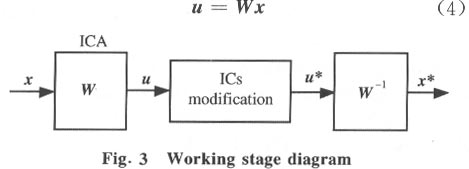
Since matrix inversion is avoided in Eq.(3), it has better computational performance and convergence speed. However, the algorithm can only be used to separate sources with super-Gaussian distributions. An elegant way of extending the learning rule to sources with either sub- or super-Gaussian distributions is to use the sign of the normalized kurtosis of the output ui as the flag for switching between these two conditions[14]. The algorithm is commonly referred as the extended infomax ICA. 1.2 Single-trial estimation based on the extended infomax ICA When the infomax ICA framework is applied to multi-channel PVEP data, the observed vector x is formed by the time series recorded at the different EEG electrodes. We retrieve the unknown mixing matrix W by estimating its inverse matrix W using the extended infomax ICA. The whole computation consists of two stages: the learning stage to find the optimal matrix W and the working stage to enhance the PVEP by choosing the independent components related to PVEP. In the learning stage, the observed data x is divided into blocks and fed into the neural network consecutively and cyclically until matrix W converges. Before that, a prewhittening step is used to improve the convergence speed and the computational stability, in which mean values are eliminated from each record of the training data and then processed by a decorrelation technique to transform their covariance matrix into an identity matrix. The data so obtained is then sent to the neural network to find the optimal W matrix. Meanwhile, some commonly used techniques for neural network training, such as momentum terms and adaptive learning rate adjustment, are properly integrated into the learning scheme. In the working stage (Fig.3), we get the output vector u by multiplying the data vector x with the matrix W found from the learning stage: Each row of u is the activation waveform of a certain independent component (IC). But, it must be emphasized that the PVEP we need (which exists in the scalp EEG records) cannot be picked up directly from the component of the vector u. Some components of u are PVEP sources, but they are located in the brain. To obtain the PVEP in the scalp EEG records, further steps must be taken. Here we choose those components of u (from their waveforms) which are related with PVEP (for example, those ICs which show prominent peaks or valleys during the time period from 0 to 300 ms) and set the remaining ICs to zero. By so doing, most parts of the uncorrelated noises as well as the spontaneous EEG will be eliminated. If the new vector so obtained is denoted as u*, then the PVEP component in the scalp records can be reconstructed by multiplying the new vector u* with W-1 :
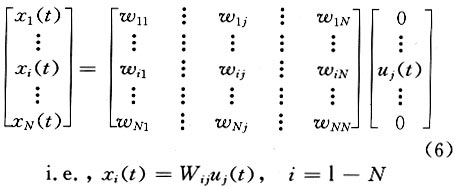
As expected, in the reconstructed data x*, clear NPN complexes are found at occipital channels, such as O1, O2 and Oz. The ICA provides not only the time course but also the spatial distribution of the ICs. The columns of the inverse matrix W-1give the projection strengths of the respective ICA components onto the scalp electrodes. The reason is explained as follows: If a single ICA component ~iuj~i is chosen from u* and all the other components are set to zero, Eq.(5) can be rewritten as (where wij is the i, j-th entry of W-1 ):
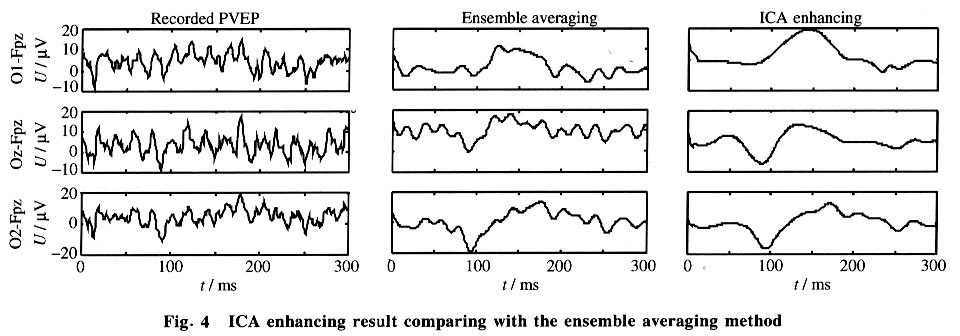
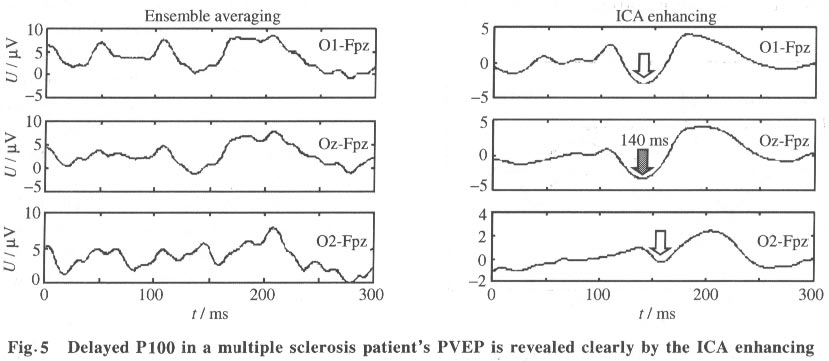
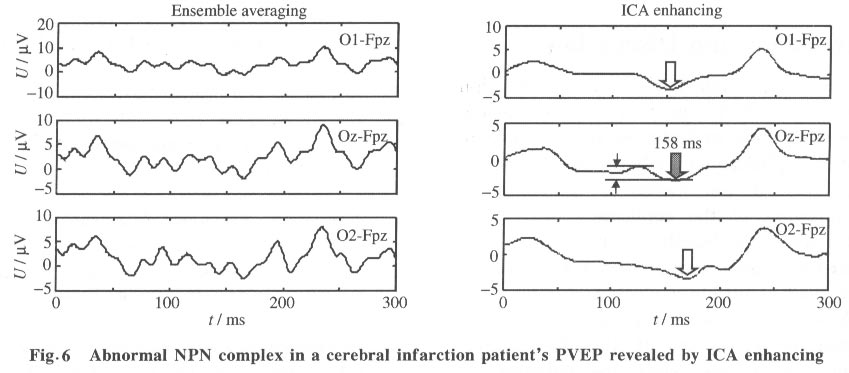
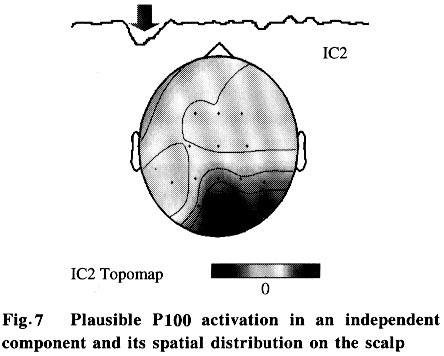
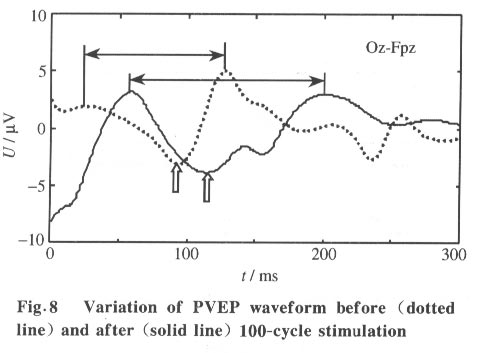
where xi(t) is the projection of the ICA component uj(t) onto the i-th electrode and wij is its projection strength. Thus, the column vector wj =[w1j ,w2j ,...,wNj ] is the projection strength over all the scalp electrodes which can be used to reveal the spatial pattern of uj(t) (at any time instant t) by topographic interpolation. The spatial pattern does not change with time. The temporal and spatial information of independent components of multi-channel EEG data can be combined to understand their physiological meaning[6 - 8]. 2 Results Currently, traditional ensemble averaging techniques are widely used in clinical applications to extract PVEP with 100 - 200 trials usually needed for the averaging. Even in some high-end instruments with denoising techniques, 50 trials are the minimum requirement for an acceptable PVEP extraction. Besides the smearing of useful information and the patient's uncomfortable feeling caused by the repeated stimulation, the extraction of PVEP by ensemble averaging is unable to get the dynamic change of the PVEP waveform with the progression of stimulation which is often desired in neurosurgery and neurophysiology studies. Our single-trial estimation and analysis method based on ICA shows the potential of removing these shortcomings. 2.1 Data acquisition The study was performed on a group of 72 patients for clinical PVEP evaluation (57 healthy and 15 abnormal according to catamnesis). The left and right hemifield checkerboard pattern reversal evoked potential was recorded by 16 Ag-AgCl electrodes placed according to the international 10/20 system. Linked ears served as the reference. The traditional black and white checkerboard pattern reversed at a rate of 2 Hz. The recorded PVEP was digitized at 1024 Hz, after which the remarkable eye movement and technical artifacts were removed. All the data acquisition was performed on a GALELIO EEG/VEP system (EBNeuro Co.). And the signal processing described here was performed on a PC. 2.2 Result on normal subjects and patients Our single-trial estimation method based on ICA was tested using the acquired 16-channel PVEP data. Figure 4 illustrates the estimation result for one normal case: the left column is the scalp potentials of O1-Fpz, Oz-Fpz and O2-Fpz (from top to bottom), the middle column is the ensemble averaging result (with 50 trials) and the right column is the result of our ICA method. (Although our method is aimed at single-trial estimation, in the current study, we had to perform all of our analysis with 3-trial averaged data, which is the lowest limit of averaging in our EEG acquisition system). As shown in Fig. 4, the ICA based method gives clearer NPN complex than the ensemble averaging method, so that the amplitude and the latency of each component of the NPN complex can be easily measured for clinical diagnosis. The P100 latency is an important index commonly used in clinical diagnosis. The P100 latencies of the 57 normal subjects were examined by both the traditional ensemble averaging method and our ICA based method. The results show good consistency between them: the ensemble averaging result is (106.3±4.5) ms and that of the ICA based method is (106.8±5.1) ms. Clinically, patients with P100 latency longer than the normal value plus three times the standard deviation are considered as abnormal. For example, the P100 latency of multiple cerebral sclerosis patients is usually found to be much longer than the normal value. Figure 5 shows the PVEP of a multiple cerebral sclerosis patient estimated by averaging (left column) and ICA based (right column) methods. The P100 latency was shown to be abnormal by both methods, but it was easier to quantify the abnormal latency from the ICA based result. Another case was a cerebral infarction patient whose P100 component was much delayed and with much lower amplitude than normal. As shown in Fig. 6, the averaging result (left column) does not clearly show the P100 which is clear in the ICA based result (right column). 2.3 Temporal-spatial pattern of P100 As mentioned above, both the temporal information and the spatial information of the independent component can be obtained by ICA. Our current study investigates the physiological meaning of the independent omponent combining component that shows clear activation around 100 ms . Moreover, this specific in dependent component can always be found in all of our normal cases. If the corresponding column of the matrix W-1 is mapped onto the scalp by means of EEG topography, a simple spatial pattern with the highest level of activation on the occipital lobe will appear which implies that this specific spatial pattern may be closely related with P100. A relation between the time course of the ICA component and its spatial pattern is thus established. Fig. 7, the waveform shown at the top is an independent component that shows clear activation around 100ms. Moreover, this specific independent component can always be found in all of our normal cases. If the corresponding column of the matrix W-1 is mapped onto the scalp by means of EEG topography, a simple spatial pattern with the highest level of activation on the occipital lobe will appear which implies that this specific spatial pattern may be closely related with P100. A realtion between the time course and its spatial pattern is thus established. 2.4 Dynamic variation of PVEP waveform The ensemble averaging method discards the uncorrelated noises as well as the variance among the trials, so the dynamic variations of the VEP from trial to trial are lost. If the single-trial estimation becomes possible, such dynamic information can then be captured. As a rough indication of the ability of the ICA method to capture the dynamic variation, we illustrate the change here by comparing the single-trial PVEP estimation before and after 100 cycles of the checkerboard pattern-reversal stimulation (Fig. 8). The after-stimulation PVEP (solid line) has a longer P100 latency and a wider NPN complex than before the stimulation (dotted line), which indicates that the long-term repeating stimulation may change the shape of the underlying PVEP. This change can be considered as a sign of the fatigue and the accommodation of the visual system. 3 Conclusions and Discussion In conclusion, a single-trial PVEP estimation method based on ICA was proposed and tested here. The simulation and clinical results indicate the potential application of ICA in the temporal-spatial analysis of the evoked potential. The overall framework of the application of ICA to EEG analysis may be briefly summarized as: let the rows of the original data matrix x be the EEG signals recorded at different electrodes, the rows of the ICA output matrix u=Wx will then give the time courses of activation of the decomposed independent components while the columns of matrix W-1 give the projection strengths of the respective independent components onto the scalp electrodes. ICA is a newly developed signal processing technique that still has many open questions for investigation. At present, in the ICA theory, the mixing should be linear and instantaneous (no propagation delays and no convolution) and the number of sensors (i.e., electrodes in EEG case) should not be less than the number of sources[6,13]. These limitations may not be completely satisfied in actual EEG analysis. Although numerical simulations and experimental results have confirmed that we can capture the time course and scalp topography of the temporally independent sources especially in the case of evoked potential analysis[7,8], the limitations mentioned above are still worthy of further study. References
Copyright 2001 - Tsinghua Science and Technology The following images related to this document are available:Photo images[ts01106f5.jpg] [ts01106f4.jpg] [ts01106f6.jpg] [ts01106f1.jpg] [ts01106f8.jpg] [ts01106f2.jpg] [ts01106f3.jpg] [ts01106f7.jpg] |
| |||||||||
