 |
| About Bioline | All Journals | Testimonials | Membership | News |
|
||||||
|
||||||
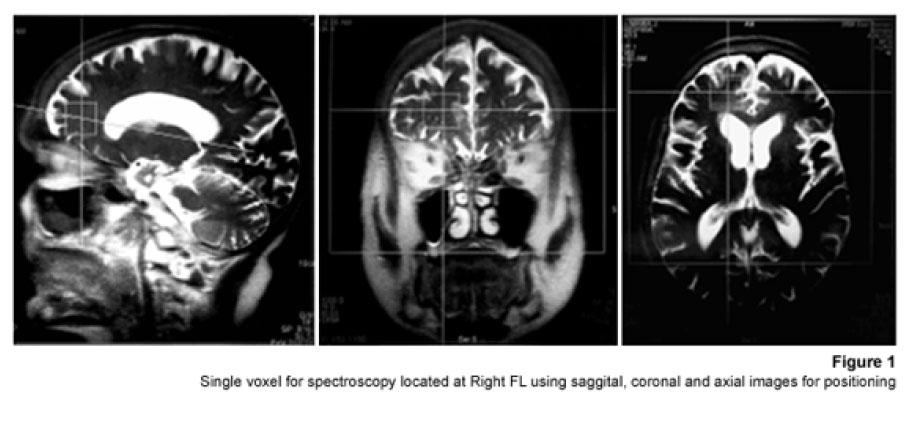
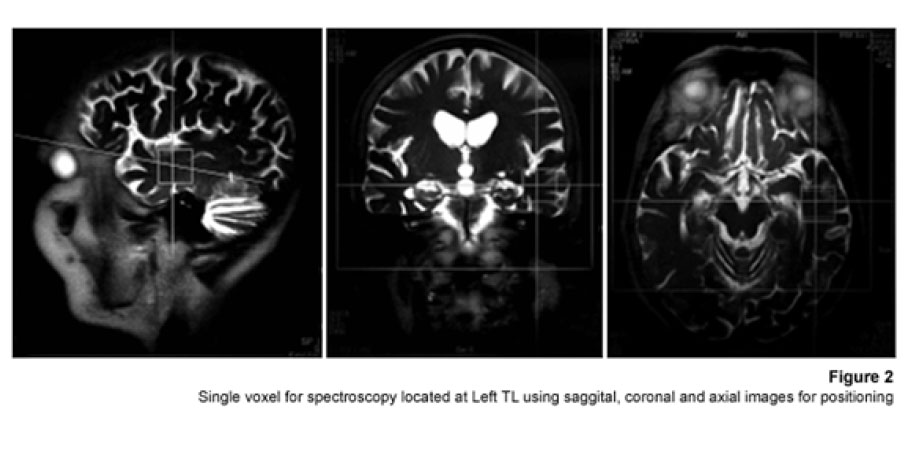
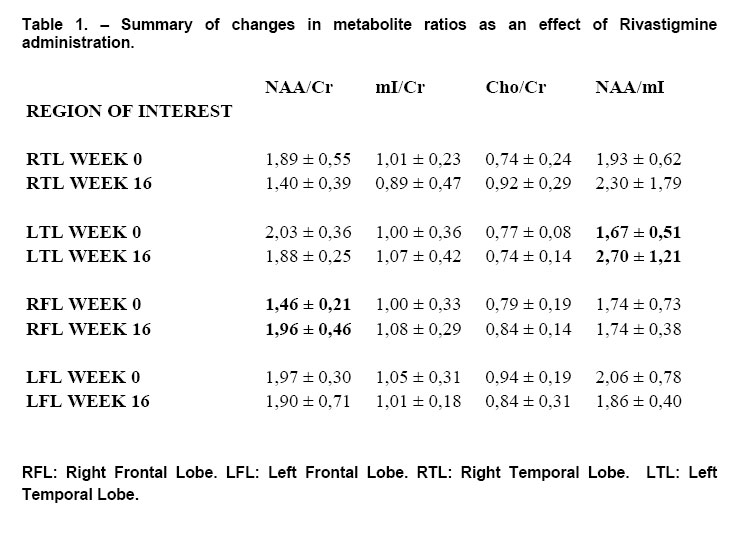
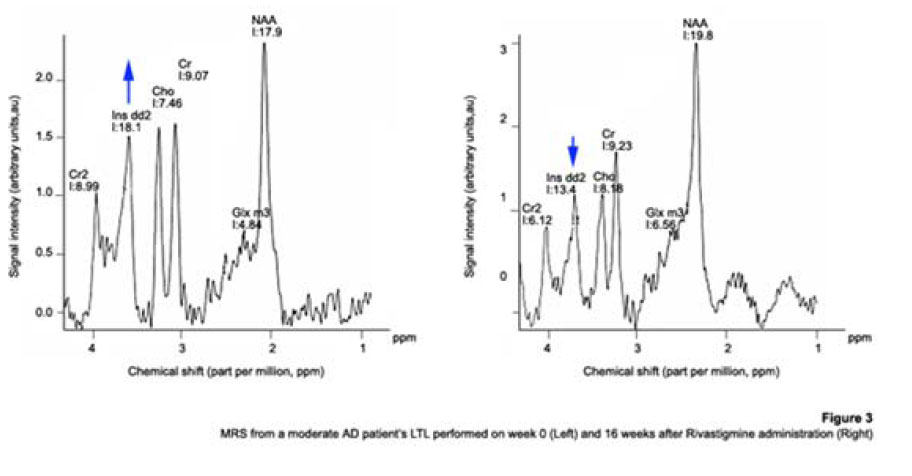
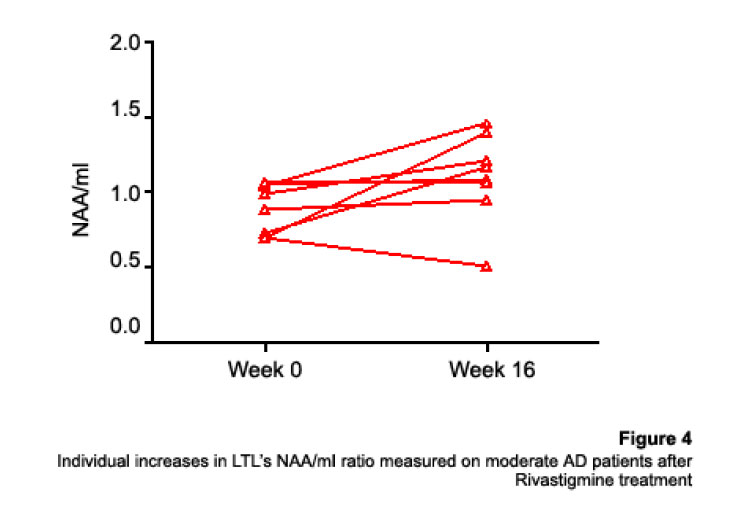
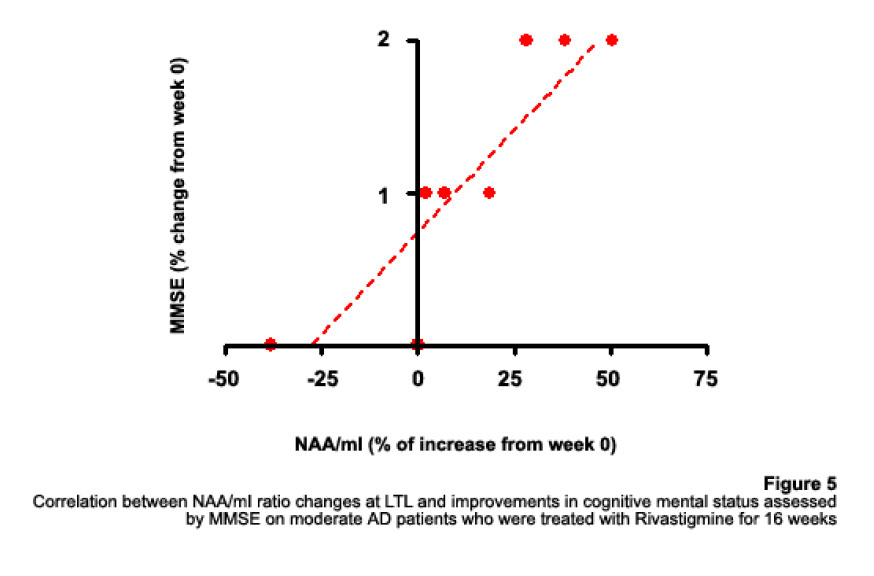
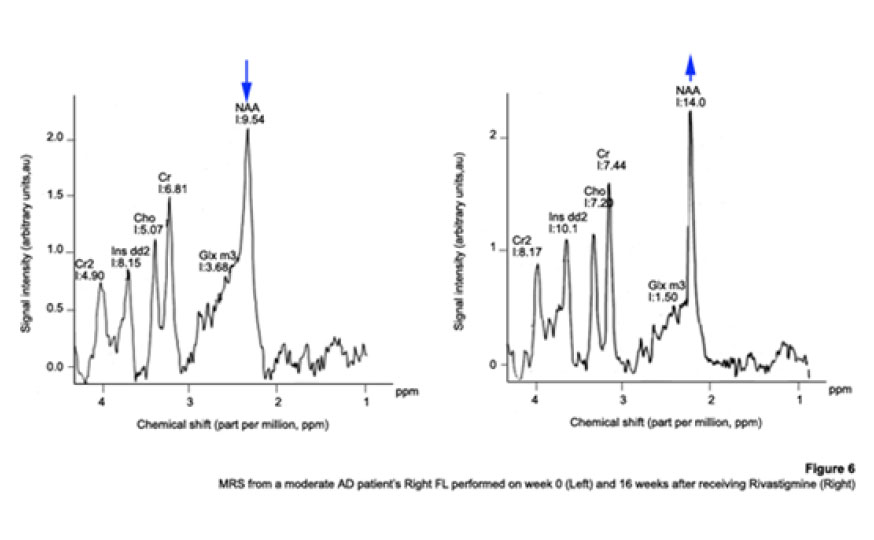
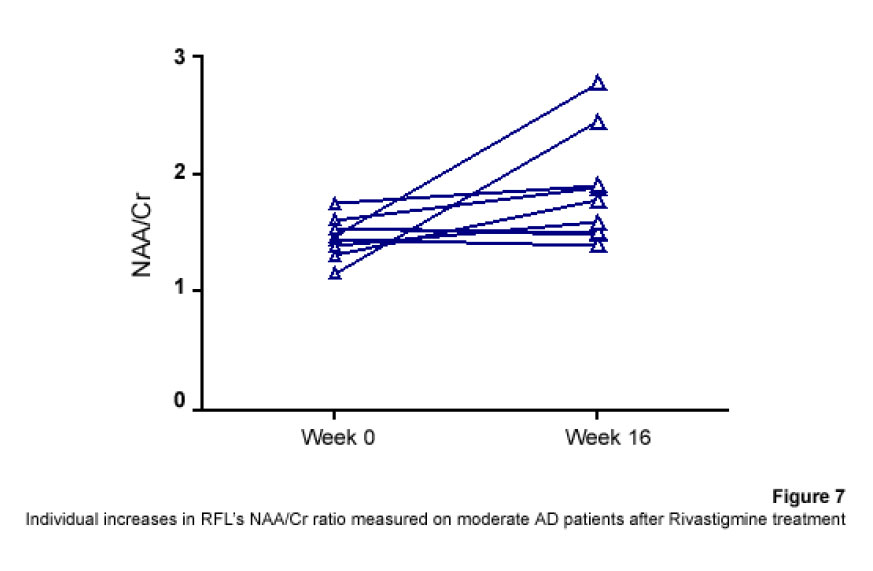
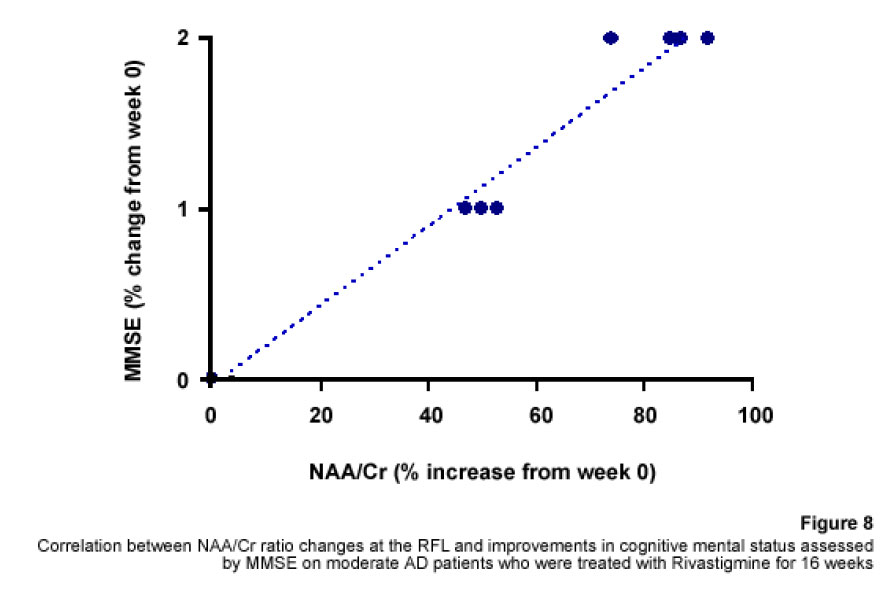
1H Magnetic Resonance Spectroscopy Assessment of the Effects of Rivastigmine on Patients with moderate Alzheimer DiseaseAlvarado Arturo, Figueroa Yelena, Mendoza Alberto, Ortíz Hodalitz, Itriago Valentina, Alvarado Mariangela Code Number: va05011 Abstract This study was designed to perform MRS of the Temporal Lobe (TL) and Frontal Lobe (FL) to assess brain metabolic changes that result from treating moderate-AD (AD) patients with Rivastigmine. Twenty AD patients were studied after obtaining both their informed consent and their caregivers’. They were divided into two groups of ten patients each one: Rivastigmine Group (RG) and Control Group (CG), and matched by age and sex. RG took Rivastigmine during 16 weeks (1.5 mg/day the first two weeks, 3 mg/day the following six weeks, and 4.5 mg/day the last eight weeks). CG took placebo during 16 weeks. Mini-Mental State Examination (MMSE), Magnetic Resonance Imaging (MRI), and MRS were performed before and after the 16-week study. MRI and MRS were carried out on a 1.5 Tesla system (Sonata, Siemens Erlangen®). Single Voxel Spectroscopy (1.8 cm x 1.8 cm x 1.8 cm = 5.83 cm3) were acquired with a 90°-180°-180° Spin-Echo Sequence (TR=1500 msec, TE=30 msec,192 averaged acquisitions). N-Acetylaspartate (NAA), Creatine (Cr), Choline (Cho), and myo-inositol (mI) intensity signals were detected and NAA/Cr, mI/Cr, Cho/Cr and NAA/mI ratios were calculated. Analysis of Variance was applied to the results. Tukey test was used for comparisons among ratio means with Bonferroni correction for small samples. Spearman rank correlation coefficients were calculated for both MMSE scores and measured metabolite ratios. A significant increase (p<0.05) in the NAA/Cr ratio for the Right FL and a significant increase (p<0.05) in the NAA/mI ratio for the Left TL were found in the RG after 16 weeks of Rivastigmine treatment. These changes were correlated to the RG patients’ improvement in cognitive mental status that was uncovered through the MMSE’s AD Assessment Scale Scores. No significant changes were found in the CG after 16 weeks of placebo treatment. MRS may provide a useful tool for monitoring the therapeutic response of AD patients to Rivastigmine. The link between MRS-based Rivastigmine monitoring and the MMSE’s AD Assessment Scale Scores may also provide a fertile ground for developing a Rivastigmine-based therapy and predicting its efficacy to improve AD patients’ cognitive status. Key words: 1H Magnetic Resonance Spectroscopy (MRS), Alzheimer’s Disease (AD), Mini Mental State Examination (MMSE), Rivastigmine Introduction Alzheimer's disease (AD) is a progressive neurological condition that results in the irreversible loss of neurons, particularly in the cortex and hippocampus. The clinical hallmarks are progressive impairment in memory, judgment, decision making, orientation to physical surroundings, and language. In 1906, Alois Alzheimer defined the clinicopathological syndrome that bears his name at a meeting in Munich. When he described the disorder in a woman in her early 50s, neither he nor his audience recognized that AD might ultimately turn out to be indistinguishable from common senile dementia (1, 2). Indeed, AD became generally accepted as the most common basis for senile dementia only after Blessed, Tomlinson and Roth (3) disclosed their work. 1H Magnetic Resonance Spectroscopy (MRS) is an application of Magnetic Resonance (MR) that allows in vivo noninvasive assessment of several local metabolite levels in brain tissue, such as, N-Acetylaspartate (NAA), mobile Choline moieties (Cho), Creatine (Cr) and Phosphocreatine (PCr), Glutamine/Glutamate complex (Glx), myo-inositol (mI), Lactate (Lac) and Lipids (Lip). NAA is mainly found in neurons within the central nervous system, but not in glial cells or other nonneuronal tissue. Although its exact metabolism remains unclear, NAA is generally thought to represent a marker of neuronal function (4, 5). The NAA level decreases in cases of neuronal loss or damage. The mI, a pentose sugar, appears to be a more specific marker for some types of dementia than NAA. The mI signal consists of glial metabolites that are responsible for osmoregulation. (6, 7). Elevated mI levels may mark gliosis, membrane dysfunction, cytoskeleton abnormalities and correlate with glial proliferation in inflammatory central nervous system demyelination (8). Another metabolite of interest for MRS is Cho. In the brain, the largest amount of Cho is found in the Choline-bound membrane phospholipids, which are the precursors for choline and acetylcholine synthesis. High Cho levels may reflect cellular proliferation, as in neoplasia, or myelin breakdown (9, 10). NAA decreases in a variety of neurological disorders, including AD (11-15). A decrease of the NAA/Cr ratio could indicate regional variations in AD (16-18). In patients with mild to moderate AD, NAA/Cr levels are lower than normal at the posterior cingulate gyrus, whereas they are normal at the medial occipital lobe, including the visual cortex (17). These regional patterns agree with the distribution of the neurofibrillary pathology and the associated neuronal loss, demonstrating that regional NAA/Cr levels are potential indicators of AD progression. Performing MRS assessment of the temporal lobe may be particularly useful as it is affected in the early course of disease progression (19-20). Since the medial temporal lobe, especially the hippocampus usually shows marked pathological changes in AD patients (21-23), this is likely to be the site where the greatest metabolic changes occur. In fact, extensive hippocampus pathology leading to early atrophy of this structure may be noticed during the pre-symptomatic phase of AD (24-25). Ross et al. (26-27) carried out the first study in which absolute concentrations of NAA, Cho and Cr, corrected for tissue atrophy, correlated with cognitive scores and hippocampus volume measurements. As well, Schuff et al. (28) demonstrated that the combination of hippocampus volume and hippocampus [NAA] discriminates AD more accurately than either measurement alone. It is well-known that the ratio of neurons to glial cells changes as a consequence of atrophy (29-30). MRS studies have consistently reported decreased brain NAA levels and increased mI levels in some brain regions in subjects with AD. Kantarci et al. performed MRS in healthy subjects (control group), probable AD patients and patients who showed Mild Cognitive Impairment (MCI) to measure metabolite ratios at the posterior cingulate, the left superior temporal lobe and the medial occipital lobe (17). Reduced NAA/Cr ratio and increased mI/Cr levels were found at the superior temporal lobe and posterior cingulate, in AD patients. However, an elevation of mI/Cr ratio at the posterior cingulate was the only significant discovery that resulted from comparing the MCI group with controls. These findings coincide with the pattern of development of AD (21). High mI levels have been reported suggesting an increase of glial content or membrane abnormalities in subjects with AD (31-35). It is thought that the elevation of the mI peak is related to glial proliferation and astrocytic activation in AD (31, 33, 36). Parnetti et al. reported that the increase of mI correlated with dementia severity and its duration (35). Therefore, NAA/Cr and mI/NAA ratios combination may provide a basis for a MRS-diagnose for AD (12, 3738). Some studies have reported high Cho and Cho/Cr levels. The elevation of Cho peak may be explained as a consequence of membrane phosphatidylcholine catabolism that provides free choline for the chronically deficient acetylcholine production in AD (39-40). The alterations of membrane biochemistry that accompany AD have profound effects on the concentration of various choline-containing compounds. An increase in Cho resonance has been observed in gray matter (31, 40-41), while decreased Cho resonance has been reported in white matter (42). This raise in gray matter Cho levels has been associated with decreases in memory function (40) and regional cerebral metabolism (43). However, other studies have reported no significant changes in the Cho resonance by proton MRS performed in subjects with AD (44-45). On the other hand, according to the cholinergic hypothesis of AD, memory impairments result from the death of cholinergic neurons in the basal forebrain (46). Cholinergic neurons may be selectively vulnerable in AD, because they require choline for the synthesis of both, the neurotransmitter acetylcholine and the membrane structural component phosphatidylcholine. The autocannibalism hypothesis suggests that cholinergic neurons degrade membrane phosphatidylcholine to compensate the deficiency of free choline used for acetylcholine synthesis in AD patients (39). This hypothesis is supported by studies performed in postmortem brain tissue from AD patients that showed higher than normal cellular levels of glycerophosphocholine, a phospholipids catabolic intermediate (47, 48). Structural changes of the neuronal membrane due to degradation of membrane phosphatidylcholine may lead to cell dysfunction and death (49). Phosphomonoesters like phosphoethanolamine and phosphocholine are considered anabolic precursors of membrane phospholipids, whereas phosphodiesters like glycerol-3-phosphoethanolamine and glycerol-3-phosphocholine are known as catabolic products from the breakdown of phospholipids (50). 31P MRS performed in AD patients showed a larger-than-normal concentration of phosphomonoesters in the temporoparietal cortex (51). This observation is an evidence that phosphomonoesters and phosphodiesters ratios are abnormal in the postmortem brain tissue from AD patients (50), suggesting that regenerative processes involving phospholipids occur early in AD, whereas degenerative processes occur later. The PCr/Inorganic Phosphorus (PCr/Pi) ratio measured by 31P MRS has been lately used to distinguish AD subjects from vascular dementia patients (51). Disturbed phospholipids metabolism in AD is also suggested by MRS evidences of increased mI/Cr ratio (by 11–22%) at the parietal and occipital cortices in AD patients in comparison to controls, as the neuronal marker NAA/Cr ratio was reduced by 5–11% (36). As mI is part of the phosphatidylinositol molecule, its increased brain concentration in AD patients could reflect accelerated breakdown of phosphatidylinositol and other phospholipids. Metabolite levels correlate with cognitive scores and dementia severity (33). Therefore, metabolite levels may be used as a diagnostic tool to help differentiating AD patients from those with other forms of dementia and age-matched control subjects. Shonk et al. (12) determined that changes in the NAA/mI ratio would help to distinguish AD patients from control subjects with 83% sensitivity and 98% specificity. Likewise, he established that changes in the mI/Cr and mI/PCr ratios would help to distinguish AD subjects from elder patients with other forms of dementia with 82% sensitivity and 64% specificity. MRS has been used to predict cognitive scores at 1-year follow-up studies (37). Controlled studies have used MRS to monitor treatment effects in AD. Decreases in the Cho/Cr and Cho/PCr ratios have been demonstrated in AD patients in response to Xanomeline administration, a muscarinic agonist (52-53). Also, increases in the NAA/mI ratio have been detected in response to Donepezil, a cholinesterase inhibitor (54). Rivastigmine is a cholinesterase inhibitor with proven therapeutic efficacy in AD (4). Doraiswamy et al. concluded on his review about the role of MRS in the drug development for dementia, that MRS measurements of NAA levels combined with hippocampal volumetry could provide highly useful surrogate markers of AD progression in the trials of neuroprotective agents (4). Our study was designed to determine the usefulness of Temporal Lobe (TL) and Frontal Lobe (FL) MRS in assessing brain metabolic changes that could result from treating moderate AD patients with Rivastigmine and to correlate those changes with the modifications of the cognitive function measured by the Mini-Mental Status Exam (MMSE) (55). Methods Patients Twelve moderate AD patients were studied after obtaining both their informed consent and their caregivers’ and the approval of the local ethical committee. The patients took Rivastigmine during 16 weeks (1.5 mg/day the first two weeks, 3 mg/day the following six weeks, and 4.5 mg/day the last eight weeks). Mini Mental State Examination (MMSE) (55) was performed twice: the first one was carried out at the beginning of the study (0 week) and the second one, 16 weeks after receiving Rivastigmine. Magnetic Resonance Imaging (MRI) and MRS MRI was performed using a 1.5 Tesla system with spectroscopy capability (Magnetom Sonata, Siemens Medical Systems®, Erlangen, Germany) equipped with a standard Head Coil. Sagittal T1 weighted, Coronal T2 weighted, Axial T2 weighted and T2 Fluid Attenuated Inversion Recovery (FLAIR) images were performed. Single Voxel Spectroscopy was acquired with a 90°-180°-180° Spin-Echo Sequence obtained from a 1.8 cm x 1.8 cm x 1.8 cm = 5.83 cm3 voxel located at Frontal Lobe (FL) and Temporal Lobe (TL). Voxels were prescribed from a saggital, coronal, and axial image series. The parameters used were: Echo Time (TE) = 135 ms, Repetition Time (TR) = 1500 ms, 256 acquisitions. NAA, Cr, Cho, and mI intensity signals were detected and NAA/Cr, mI/Cr, Cho/Cr and NAA/mI ratios were calculated. Typical voxel locations at FL and TL are shown in Figures 1 and 2. MRI clinical applications allowed us to perform spectroscopic examinations on a data acquisition time limited to 30 min per subject according to the tolerance of the patients. FL study obeys to AD patients previous history of deficits in frontal system tasks with variable changes in memory (56). Volume of Interest (VOI) selection at TL was done based on previous reports of abnormalities in patients with AD (57-58). Analysis of Variance (ANOVA) was applied to the results. Tukey test was used for multiple comparisons among ratio means with Bonferroni correction for small samples. Multiple linear regression analysis was performed to assess differences in brain metabolite ratios between the two observations. Spearman rank correlation coefficients were calculated for both MMSE scores and measured metabolite ratios. Results Table 1 represents the four metabolite ratios calculated according to the anatomic region studied (Temporal Lobe or Frontal Lobe) and the Rivastigmine administration by the time the examination was performed (Week 0 or Week 16). NAA/Cr ratio at the RFL and NAA/mI levels at the LTL show significant differences after 16 weeks of Rivastigmine administration when Tukey test was applied for comparisons among ratio means with Bonferroni correction for small samples (p<0.05). Figures 3 shows MRS performed at the LTL in a moderate AD patient on week 0 (Left) and 16 weeks after Rivastigmine treatment (Right). It is clearly noticeable the significant change (p<0.05) in NAA/mI levels between the two observations. NAA/mI ratio increased from 0.99 (week 0) to 1.48 (week 16). Figures 4 represents individual values of NAA/mI ratio measured at the LTL in moderate AD patients who participate in our study. Figures 5 shows the correlation between MMSE changes and the increase of the NAA/mI ratio at the LTL in moderate AD patients treated with Rivastigmine for 16 weeks. r Spearman coefficient was = 0.94, p<0.004. Figures 6 represents MRS performed at the RFL in a moderate AD patient on week 0 (Left) and 16 weeks after Rivastigmine treatment (Right). It is clearly noticeable the significant increase (p<0.05) in NAA/Cr levels between the two observations. NAA/Cr ratio changed from 1.35 (week 0) to 2.11 (week 16).Figures 7 represents individual values for NAA/Cr ratio measured at the RFL in moderate AD patients who participate in the study. Figures 8 shows the correlation between MMSE changes and the increase of the NAA/Cr ratio at the RFL in moderate AD patients treated with Rivastigmine for 16 weeks. r Spearman coefficient was 0.97, p<0.002. Discussion Eight moderate AD patients successfully completed the study protocol meeting the criteria of spectral quality. In Table 1, the data are displayed as means ± standard deviation. Neither mI/Cr nor Cho/Cr ratios show differences in any of the four brain regions studied 16 weeks after Rivastigmine administration as compared with the baseline measure performed on week 0. However, two metabolite averaged ratios show significant differences as compared with their baseline measures. As Table 1 shows, the NAA/Cr ratio raised from 1.46 ± 0.21 to 1.96 ± 0.46 at the RFL (p<0.05) and the NAA/mI ratio increased from 1.67 ± 0.51 to 2.70 ± 1.21 at the LTL (p<0.05). Some authors have reported decreased NAA levels at the Medial Temporal Lobe in AD patients (16, 33-34, 59). Nevertheless, our results show an increase of the NAA/mI ratio at the LTL after Rivastigmine administration. The elevation of the NAA/mI ratio may reflect a decrease of the mI signal as an effect of the Rivastigmine administration instead of an increase of the NAA signal as Figure 3 shows (MRS from the AD patient identified with the number 1). In 1993, Ross and coworkers reported a 22% increase in mI levels and an 11% decrease in NAA residues at the parietal (white matter) and occipital (gray matter) cortices in AD patients as compared with healthy subjects (60). They conclude that the elevation of mI levels in mild to moderate AD patients suggests that abnormalities inherent to the inositol polyphosphate messenger pathway may occur early in the natural history of AD. Therefore, the detection of high mI and low NAA levels through the MRS examination promise to be an early diagnostic test for AD. Later, in 1995, the same research team reported that reduced levels of NAA and increased levels of mI at the occipital region (gray matter) characterized AD as compared with the significantly reduced levels of NAA but normal levels of mI found in patients with other forms of dementia (61). Finally, they proposed that the mI/NAA ratio could be used to distinguish an AD brain from a healthy brain with 83% sensitivity and 98% specificity. Recently, Renshaw et al. (62) found a reduction of the NAA levels at the anterior temporal lobe in patients diagnosed with probable AD using a short MRS test. This change was not observed in patients whose memory loss and other cognitive declines were not attributed to AD suggesting that its detection may help to diagnose AD. The research team led by Renshaw did not observe changes in NAA/mI or mI/Cr ratios. For them, the large variances within the mI values reported in the literature may be due to measurement errors, changes in the metabolite levels per se or limitations inherent to the echo time used during the studies. On the other hand, Huang et al. (34) reported increases in absolute concentration of mI at the right and left parietal lobes in mild, moderate and severe AD patients in comparison with control subjects. More recently, Herminghaus et al. (63) reported decreased total NAA levels and increased mI levels as a common hallmark for Vascular Dementia (VD) and AD, which are considered the two most common types of dementia. These authors also reported a significant increase of the mI/total Cr ratio at the mid-parietal gray matter, the parietal white matter and the superior and medial temporal gyrus from the dominant hemisphere according to the handedness of each AD patient. Chantal et al. (64) reported a statistically significant increase of the mI/H2O ratio at the right parietotemporal cortex in AD patients as compared with those who showed MCI and control subjects. The meaning of the increased mI levels in the course of AD is a fertile ground for MRS-linked research. The hypothesis proposed by Wurtman et al. (39, 49) explains the pathogenesis of AD based on cholinergic neuronal damage. However, it is possible to consider a role of mI in the course of AD that can be sustained by many evidences. For example, Stokes and Hawthome (65) noticed a marked depletion of phosphatidylinositol (PI) – a membrane lipid – in the postmortem brain tissue from AD patients. They granted it to a defective biosynthesis of PI. Jolles et al. (66) described a diminution in the activity of the inositol polyphosphate enzyme called phosphatidylinositol kinase. Likewise, he identified a specific defect within the inositol polyphosphate cascade in brain tissue from AD patients that may explain the impairments registered in the cholinergic activity. Other research teams (60-61, 67) reported a 20% to 30% increase in the concentration of mI (the polyol found at highest concentrations in brain tissue among other inositol-linked metabolites) in mild-to-moderate AD patients, which was not detected in other forms of dementia (61). Shonk and Ross (68) performed MRS in adults with Down's Syndrome and observed that a significant elevation of mI levels occurs before each onset of dementia without any concomitant reduction of the neuronal marker NAA. In 1999, the research team led by Huang and Rapoport corroborated these results posing that the approximately 50% higher mI levels found at the occipital and parietal regions in adults with Down’s Syndrome suggest a gene dose effect from the extra 21st chromosome, where the human osmoregulatory Na+/mI cotransport gene is located (69). However, what causes the increase of mI levels in AD remains unclear. An excessive activity of the inositol monophosphatase early in AD course could result in the conversion of Inositol-1Phosphate (IP) to mI. Inositol monophosphatase now appears to be the most intensely regulated enzyme within the IP cascade (70). An enhanced activity of the Na+/mI transporter placed on the membrane of glial cells could produce higher steady-state mI concentrations. On the other hand, an inhibition of the enzymatic conversion of mI to Phosphatidyl Inositol (PI) may explain the reduced PI levels found in the postmortem brain tissue from AD patients and the increased mI levels, as well. Figure 4 shows the individual increases of the NAA/mI ratio measured in moderate AD patients after Rivastigmine treatment. The AD patient identified with the number 8 showed no change in NAA/mI ratio between the two measurements. Only the AD patient identified with the number 7 showed a decrease in NAA/mI ratio after completing the treatment. An additional evaluation was performed in this patient on week 20, where worse cognitive status was found as compared with the other 7 patients who successfully completed the study. Therefore, the NAA/mI ratio could be used to predict the pharmacological response from AD patients to Rivastigmine. However, further investigations involving a larger number of patients are required to verify this hypothesis. Figure 5 shows the correlation between MMSE improvements and the increase of the NAA/mI ratio. A significant association between these two variables was obtained according to the Spearman rank correlation (p<0.004). Our results agree with the previous reports from several research teams, such as the ones led by Jessen et al. (71), Chantal et al. (72) and Kantarci et al. (73). Wadman and Rai (74) carried out a study that fortifies the characteristic association between decreased NAA levels and increased mI levels found at the parieto-occipital region, and cognitive impairments linked to AD. Martínez-Bisbal research team (75) reported that NAA/mI ratio provides the best area under the ROC curve for diagnosing AD with the highest sensitivity (82,5%) and specificity (72,7%). So that, exploring the benefits of using a cholinesterase inhibitor in AD patients to reduce mI levels seems to be pertinent at this point (76-80). Nowadays, it is difficult to establish a relation between the high mI levels observed in AD patients and the pathophysiology of the disease itself. Abnormal mI concentrations alter the physiology of the brain in AD patients due to the changes in the enzymatic equilibrium and the concentration of metabolites within the inositol polyphosphate cascade. These changes are, in turn, caused by variations in the mechanisms of hormone receptors, the hormone sensitivity, the hormone response or the adaptative modifications of the cellular events that require inositol-linked metabolites as second messengers. Therefore, modifying brain mI concentrations could have a beneficial effect for AD patients according to the progression of the disease. Figure 6 shows the MR spectra from the AD patient identified with the number 4. It is clearly noticeable the increase in NAA/Cr ratio measured at the RFL between the two observations (Week 0 and Week 16). The variation of the NAA/Cr ratio could be the result of an apparent recovery of the NAA signal due to the Rivastigmine administration. Previous studies have reported decreased NAA/Cr ratios and reduced absolute NAA concentrations at the hippocampus, parietal and temporal lobes in AD patients. These results coincide with the anatomic location of the damaged areas identified during the autopsies of the brain tissue from AD patients (11-12,18,20,28-30,34,37). The study of the Frontal Lobe is closely related to MCI and Picks Dementia (Frontal Lobe dementia) rather than to AD. However, in 1995, Christiansen et al. (81) used fully relaxed water signal as an internal standard in a STEAM experiment to measure [NAA], [Cho], [Cr] and [Cr + PCr] at the Frontal Lobe in 12 probable AD patients. The NAA concentration was significantly lower in probable AD patients as compared with the healthy volunteers. No significant differences were found in other metabolite concentrations. Figure 7 shows the individual increases in NAA/Cr ratio measured at the RFL after Rivastigmine treatment. Increased NAA/Cr ratio only registered at the RFL could reflect an apparent recovery of the NAA signal at the Right Hemisphere of the Brain in AD patients. Krishnan et al. (82) reported that treating AD patients with placebo was associated to relative declines in neuronal concentrations of NAA, relative loss of hippocampal volume and relative cognitive impairments. While treating them with Donepezil was associated to relative increases in neuronal NAA concentrations at certain brain regions (between Week 6 and Week 18) and a greater preservation of hippocampal volume. Figure 8 shows the improvements in the cognitive status measured in AD patients 16 weeks after Rivastigmine administration. As well, it illustrates the correlation between MMSE changes and the NAA/Cr ratio at the RFL. A significant association between these two variables was obtained according to the Spearman rank correlation (p<0.002). Once again, our data agree with the previous results reported by Krishan, who demonstrated that treating AD patients with a cholinesterase inhibitor (Donepezil) causes improvements in cognition as compared with the effects of the placebo-based treatment measured several times throughout the study. It is important to mention that decreases in NAA concentration at the Frontal Lobe have been previously reported in other conditions that may precede or coexist with AD. In 1997, Ernst and coworkers reported a 28% reduction of N-acetyl compounds at the frontal lobe in patients with frontotemporal dementia (33). More recently, Kizu et al. (83) reported decreased NAA/Cr ratios in both sides of the frontal lobe in patients with frontotemporal dementia. But, NAA levels naturally decrease at the frontal lobe as an age sign in healthy people. Brooks et al. (84) registered a 12% decrease in NAA concentration at the FL between the third and seventh decades of life in healthy subjects. Likewise, Sijens et al. (85) reported significant decreases of the NAA concentration in healthy men and women according to age correlation analyses. From now on, future research projects must go deeper into the mechanisms involved in the increase of NAA signal (NAA/Cr ratio) and the possibility of slowing down the progression of AD using Rivastigmine. These investigations must focus on verifying the hypothesis concerning how cholinesterase inhibitors, such as Rivastigmine and Donepezil, may delay the neurodegeneration or AD progression. However, we are well aware that the multiple difficulties related to the understanding of AD pathophysiology should be solved first, because the neuronal loss mechanisms still remain unclear. The results published in this report are preliminaries and must be registered again using a larger number of AD patients. For the time being, we can pose that preventing or reversing the accumulation of mI in the brain tissue from AD patients may conserve the neuronal function by inhibiting the secondary loss of NAA. mI levels at the TL appear to be a pretty specific surrogate marker for AD, although its biochemical meaning in this context is uncertain. Our results emphasize the importance of short TE measurements, which allow the evaluation of mI levels. Short echo time MRS may become a potential strong, accessible and cost-effective tool to assist the physicians in the management of patients with memory problems. It is likely to be particularly useful for the early diagnosis of AD in cases where the clinical features are not quite definitive during AD initial presentation. In fact, in 2005, Modrego et al. (86) reported that MRS is capable of predicting the conversion from MCI to probable AD. In conclusion, MRS may provide a useful tool for monitoring the therapeutic response from AD patients to Rivastigmine. The link between the Rivastigmine monitoring by MRS and the MMSE’s AD Assessment Scale Scores changes may also provide a fertile ground for developing a Rivastigminebased therapy and predicting its efficacy to improve the cognitive status in AD patients. References
Copyright 2005 - Centro de Análisis de Imágenes Biomédicas Computarizadas CAIBCO, Instituto de Medicina Tropical – Facultad de Medicina, Universidad Central de Venezuela The following images related to this document are available:Photo images[va05011f3.jpg] [va05011f2.jpg] [va05011f7.jpg] [va05011f4.jpg] [va05011f1.jpg] [va05011f5.jpg] [va05011t1.jpg] [va05011f6.jpg] [va05011f8.jpg] |
| |||||||||