 |
| About Bioline | All Journals | Testimonials | Membership | News |
|
||||||
|
||||||
Zootecnia Tropical, Vol. 25, No. 1, 2007, pp. 9-18 Estimation of covariance components for the first four lactations in Holstein cattle according to different models Estimación de componentes de covarianza con diferentes modelos para las primeras cuatro lactancias en ganado Holstein Alejandro Palacios Espinoza1, José Luis Espinoza Villavicencio1*, Dianelys González-Peña2, Danilo Guerra Iglesias2, Rafael de Luna De La Peña1 y Felipe Rodríguez Almeida3 1 Universidad Autónoma
de Baja California Sur, Carretera
al Sur km. 5.5, CP 23000, La
Paz, BCS, México. *Correo electrónico: jlvilla@uabcs.mx ABSTRACT Milk production of Cuban Holstein cows was analyzed. There were 15415 lactation records of 9382 cows, which gave birth to the calves of 482 sires. Three models were established to study the milk production for 305 days during each of the first four lactations. Model I was an independent univariate analysis of milk production for lactation. Model II was a repeatability model where lactation was considered the repeated measurement of the same characteristic. Model III was a multivariate analysis in which each lactation was considered an independent characteristic correlated with the rest. The program REMLF90 was used for the analyses. The data show that for the Holstein breed under these study conditions, the estimation of covariance components for milk yield in the first four lactations are best carried out using a multivariate animal model. Keywords: covariance, heritability, correlations, Cuban Holstein. RESUMEN Fueron analizadas 15415 lactancias de 9.382 vacas Holstein en Cuba, hijas de 482 sementales. Se establecieron tres modelos para estudiar la producción de leche en 305 d durante las primeras cuatro lactancias. El Modelo I fue un análisis univariado de la producción de leche de cada lactancia, el Modelo II fue un modelo de repetibilidad donde cada lactancia se considera una medida repetida de un mismo rasgo y el Modelo III fue un análisis multicarácter donde cada lactancia se consideró un rasgo independiente correlacionado con las restantes. Se empleó para el análisis el programa REMLF90. De los resultados obtenidos se puede concluir que en la raza Holstein bajo las condiciones en estudio, la estimación de componentes de covarianza se pueden llevar a cabo favorablemente mediante un modelo animal multicarácter, siendo éste modelo la mejor opción para la evaluación genética de bovinos Holstein respecto a la característica producción de leche en sus primeras cuatro lactancias. Palabras clave: covarianza, heredabilidad, correlaciones, Holstein Cubano. INTRODUCTION There are various procedures for predicting the milk yield genetic value of dairy cattle (Norman et al., 1991). Generally, the primary goal of evaluation is to obtain precise predictions of the genetic value of an individual, so that the genetic gain of the population can be maximized (Henderson, 1975). Thus, the correct estimation of genetic parameters that guarantee an accurate prediction of genetic merit is of great importance (Schaeffer, 1984). The basic difference between the procedures is related mainly to the amount of information used, and the possibility of making more frequent evaluations without having to manipulate a great amount of information (Martínez et al., 1999). In this way, numerous authors have demonstrated that information about the first lactation is a good indicator of the productive performance of a cow. In general, the genes that affect milk production in the first lactation also influence production in the following, and although it is desirable to include more lactations, this can cause a dramatic change in rank of genetic values due to selection effects (Teepker & Swalve, 1988; Alburquerque et al., 1996; Pösö & Mäntysaary, 1996a; Guo et al., 2002). García-Cortés et al. (1995) demonstrated that medium to high positive genetic correlations exist among the milk yields of the first lactation and the rest, and recommended a multivariate analysis including the four first lactations. The present work was conducted to estimate the covariance components of milk yield during 305 days of each of the first four lactations of Holstein cows under Cuban environmental conditions and management, using the BLUP procedure, and univariate, repeatability, and multivariate animal models. MATERIALS AND METHODS The information analyzed was collected at several Holstein cattle farms in Havana province, located between 20 and 23° N, and 74 and 85° W. A warm tropical climate prevails in most of Cuba. There are two clearly defined seasons: the rainy (summer) season from May to October, in which 70-80% of rain falls (960 mm), and the dry (winter) season from November to April (240 mm). The average annual temperature is 23.1°C, with relative humidity of 60-70% during the day and 80-90% during the night (Hernández et al., 1998). There were 15,415 at 305-day milk production records of Holstein cows which calved between 1990 and 2003, distributed in 188 farms. The feeding system was based on grazing by approximately 12 h a day. Cows were fed mainly Stars grass (Cynodon nlemfuensis) and Guinean grass (Panicum maximum), but during the rainy season, the cows were fed additional natural grass. Cows were milked twice a day, and during each milking they were fed 0.45 kg of concentrate per liter of milk from the fourth liter produced. In the afternoon, the animals were kept in the barn and fed cut forage such as King Grass (Penisetum purpureum) and Cane sugar (Saccharum officinarum). Production data were included for any and up to the first four lactations. There were 9,382 first (L1), 3,468 second (L2), 1,604 third (L3), and 961 fourth (L4) lactations recorded. The quarter of the year of calving was used as a time criterion. Contemporary groups were defined by the combination of farm, and the year and quarter of calving. The genealogy file was comprised by 40,591 animals. This included all known individuals up to the second generation of ancestors, and in cases that the identity of an ancestor was not known, it was replaced with a zero. The data were analyzed with the program REMLF90 (Misztal, 1999), which uses a REML procedure with an accelerated EM algorithm. The following statistical models were used. Model I. Univariate analysis The lactations were analyzed individually using the following model: where:
It is assumed that 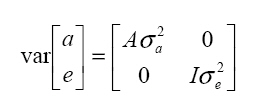 where: A is the matrix of additive relationships between individuals, I is the identity matrix, and σ2a and σ2e are the additive and residual genetic variances, respectively. Model II. Repeatability analysis Milk production records per lactation were used as repeated measurements for a given animal. This assumes genetic correlation equal to 1 among the various lactation measurements, according to the following statistical model: in which y, b, a, e, X, and Z are defined as in Model I, but with the production observations for the different lactations as if they were a single characteristic, pe is the random effects vector of the permanent environment, and W is the incidence matrix that relates the observations in y with the cows in question. It is assumed that 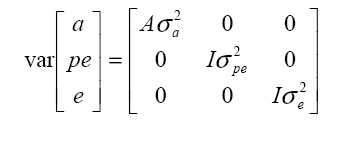 where: σ2pe is the variance of permanent effects in the natural environment. Model III. Multivariate analysis The following statistical model was adjusted for the four lactations: 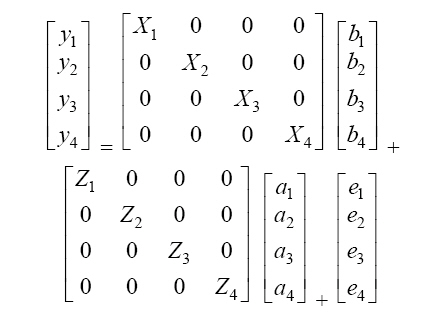 where:
It is assumed that 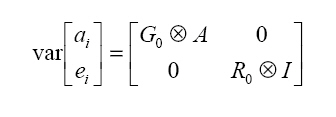 where:
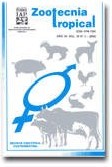
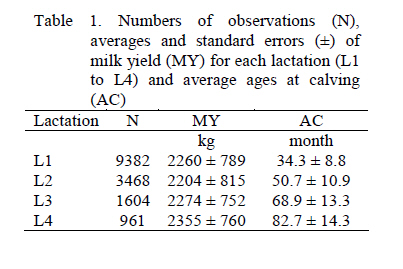
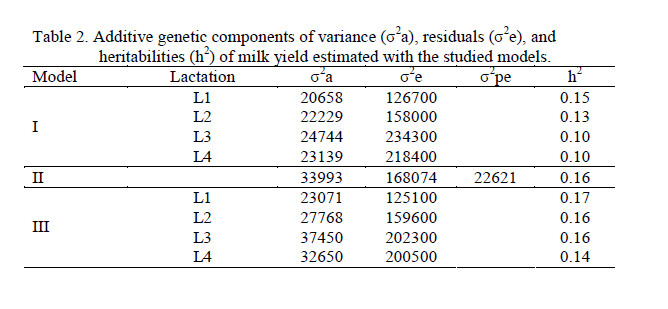
Thus, each lactation was considered as an independent characteristic. RESULTS AND DISCUSSION Milk yield Table 1 shows averages and standard deviations for milk yield of the 305-day lactations, and the calving ages (AC). The averages for milk yield in this study were a little higher than those of Friesian cows in Zimbabwe (2015 kg) in the smallholder sector, in that natural pasture accounted for 90% of feed available during the wet season (Ngongoni et al., 2006). However, the averages for milk yield in this study were lower than those observed in Brazil by other authors for the same breed (Barbosa & Fernandes, 2000; Ferreira et al., 2001; Arione et al., 2005) and for Brown Swiss (Vieira et al., 2003). Milk yield was lower than that observed for Harton from Valley x Holstein Colombian cows, grazing in a tropical environment and feeding on a concentrated supplement during milking (Vargas et al., 2006). These differences, probably due to the downfall of socialism in eastern Europe, had serious repercussions on Cuba's trade situation and undermined development of the livestock sector. Since then, Cuba's livestock sector has emphasized self-sufficiency, based on the utilization of pasture (Pérez, 1999). During the 90s, milk production in Havana province was reduced from 320 to 60 million liters annually, which parallels the importation of cattle feed (Monzote et al., 2005). Heritability Variance components and heritabilities obtained with each model appear in Table 2. A larger residual variance for later lactations is observed relative to the first. The univariate and multivariate models showed larger residual variance in the later lactations than the first. This could be caused by factors that do not influence the first lactation, but only the following, such as previous dry period and period of service, among others (Teixeira et al., 1996). Similarly, heritability was estimated by applying the REML method, using records for another Cuban Holstein herd from between 1990 and 2000 (González–Peña et al., 2003) and using the DFREML algorithm in Ayrshire cattle in Kenya (0.12) where the poor performance is not only due to the direct effect of climate, but more importantly the poor quality of roughage, low concentrate feed inputs and the high incidence of diseases and parasites and poor economic environment and infrastructure (Amimo et al., 2007). In general however, the heritability values determined in each model were below those found in the Holstein breed from Japan (0.30), and Mexico (0.26), in which Mitsuyoshi & Van Vleck (1994) and Palacios-Espinosa et al. (2001), respectively, applied DFREML using an animal model with repeated records to estimate variances. A MTDFREML algorithm was used on Holstein cattle from Brazil (Barbosa & Fernández, 2000), and a heritability value of 0.30 was obtained. A limited number of records used for parameter estimation, which are not confirmed by repeated estimations based on different random samples of data, may lead to misleading results (Strabel et al., 2005). Accordingly, Pool et al. (2000) stated that their preliminary results from 8000 lactations were inconsistent and indicated that more data should have been used for estimation. In a study using the AIREML algorithm of lactation records for crossbred Holstein cattle from dairy organizations and smallholders throughout Thailand, heritability was upwardly biased when data from only small herds were included. This might imply that a small number of records per contemporary group affected the estimate and caused confusion between additive and permanent environmental effects (Chanjivit et al., 2005). Based on these references, the estimated heritability for the third (1604 records) and fourth (961 records) lactations, using the univariate model in this study might be downwardly biased. In other work however, the heritability of milk yield was 0.31 when 274 records were used in a linear regression model (Yang et al., 2005). The heritability values obtained for each lactation using univariate analysis were lower than those using the repeatability model, but the repeatability model assumed that yields in different lactations had a genetic correlation of 1 (Yang et al., 2005). In this study the genetic correlations between lactations were less than 1. Using multivariate analysis, the heritabilities for the first and second lactations were close to those estimated by the repeatability model, while those of the third and fourth lactations were higher, possibly due to correction of selection bias made by multivariate analysis. The performance of the heritability estimates in this study coincides with that of Alburquerque et al. (1996), who concluded that the heritability for milk yield in the first lactation was higher than for later lactations. Al-Seaf et al. (2007), using a MTDFREML algorithm, obtained heritabilities of milk yield in Holstein cows of 0.18, 0.18, and 0,14 for lactations 1, 2, and 3+, respectively. However, Pösö & Mäntysaary (1996b), using linear multitrait REML, showed that the heritability for the third lactation was higher than for the second. A multiple-lactation model was applied in the first 3 lactations of Polish Black and White cattle by Strabel & Jamrozik (2006), who found heritabilities of 0.18, 0.16, and 0.17 for 305-day milk yields in the first 3 lactations. In this study, estimates of heritability for yields in later lactations were a little less than for lactations 1 and 2 (univariate analysis) or lactation 1 (multivariate analysis); this could result from selection in lactations 1 and 2, which could reduce the range of differences of later records (Al-Seaf et al., 2007). Correlations The lowest genetic correlations across lactations were between first and third parities (0.62) and the highest between third and fourth parities (0.88); the rest varied between 0.02 and 0.21 (Table 3). Another study reported genetic correlations of 0.69 0.79, and 0.98 between parities 1 and 2, 1 and 3, and 2 and 3, respectively (Mrode & Swanson, 2003). Carlén et al. (2004) found the highest genetic correlations across lactations between second and third parities (0.99) and the lowest between first and third parities (0.90) in Holstein cows. Estimates of genetic correlations above 0.96 between 305-d milk production for different parities were reported in Chinese Simmental cattle (Yang et al., 2005). In this research, the differences in genetic and residual correlations among lactations varied between 0.47 and 0.63, so application of multivariate analysis is valid according to Schaeffer (1999), who suggested the feasibility of this type of analysis for characteristics where there are large differences between the genetic and residual correlations, preferably greater than 0.50. Breeding values Expected progeny difference (EPD) values for the worst and best sires for each lactation and model used appear in Table 4. Notice that the greatest differences appeared with Model II, but this is because the analysis included all lactations from the first to the fourth. Therefore there is a greater variation, and the sires with first lactation calves only could be affected. With the univariate model, higher differences between maximum and minimum breeding values (worst and best sires) were in lactations 1 and 2, whereas with the multivariate model greater differences occurred in the third and fourth lactation. For a given lactation, the greatest difference between maximum and minimum breeding values occurred when multivariate analysis was applied. These differences probably favor a multivariate model, due to correction of selection bias. For example, the predicted breeding values for the third lactation varied from -141.7 to 81.5 kg when the univariate model was used, indicating that the calves had a genetic amplitude of 223.2 kg, but that amplitude was almost 40% greater when a multivariate model was used. The correlations of Pearson and Spearman appear in Table 5 above and below the diagonal, respectively, for the estimated genetic values for the sires in the different models. In univariate and multivariate models, the genetic correlations for the different lactations varied from 0.02 to 0.15 and from 0.72 to 0.97, respectively. The residuals went from 0.04 to 0.33 in Model I, and from 0.65 to 0.96 in Model III, showing correlations from 0.02 to 0.98 among the estimated genetic values. Correlations among estimated genetic values in Model II varied from 0.03 to 0.38 with Model I, and from 0.32 to 0.38 with Model III. These results suggest a greater consistency in global response to selection using a multivariate animal model in the prediction of genetic values.
CONCLUSIONS The results presented here show that the multivariate animal model was the best for genetic evaluation of milk yield for Holstein cattle in Cuba. This model produced the greatest differences between genetic and residual correlations, the highest heritability values for the four lactations, the highest values of expected progeny difference for the best and worst sires, as well as the greatest correlation among estimated genetic values. In addition, the fact that genetic correlations for milk yields between parities all are not equal to 1 proved adequately that estimation of genetic parameters for milk yields using a multivariate animal model on parities was more reasonable than a repeatability animal model in Cuban Holstein cattle. LITERATURE CITED
Copyright 2007 - Zootecnia Tropical The following images related to this document are available:Photo images[zt07002t1.jpg] [zt07002t3.jpg] [zt07002t2.jpg] | |||||||||||||||||||||||||||||||||||||||||||||||||||||||||||||||||||||||||||||||||||||||||||||||||||||||||||||||||||||||||||||||||||||||||||||||||||||||||||||||||||||||||||||||||||||||||
| |||||||||