 |
| About Bioline | All Journals | Testimonials | Membership | News |
|
||||||
|
||||||
Indian Journal of Human Genetics, Vol. 8, No. 1, Jan-Jun, 2002 pp. 26-28 Short Communication Study of Some Genetic Markers in Sishta Karanam Population, Andhra Pradesh, India
Naidu VM1, Ramesh M2, Rao TV2, Veerraju P2 1Centre for Cellular and Molecular Biology, Uppal
Road, Hyderabad-500 007 and 2Department of Human Genetics, Andhra University,
Visakhapatnam-530 003. Code Number: hg02006 A total of 76 individuals belonging to Sishta Karanam population, Andhra Pradesh, were tested for polymorphism in ABO and Rh (D) blood groups, two serum proteins, Haptoglobin and Ceruloplasmin, and one red cell enzyme, Glyoxalase-I. All the systems except Caeruloplasmin showed polymorphism. The frequency of AB phenotype is found to be highest in the Sishta Karanam when compared to the other caste populations of Andhra Pradesh so far studied. It was observed that the ABO system was not in Hardy-Weinberg Equillibrium. The Hp1-1 phenotype was absent in this population. The Glyoxalase-I locus showed all the 3 phenotypes. Key words: Polymorphism, Blood groups, Serum proteins, Red cell enzyme, Sishta Karanam The present study population Sishta Karanam from Allipuram, Visakhapatnam, Andhra Pradesh is believed to have originated in Orissa, a neighboring state of Andhra Pradesh inhabiting the coastal line of Bay of Bengal. They have been migrating towards the coastal districts of Andhra Pradesh since many years. The term Korono corresponds to their profession as village accountants. Although there are no current and precise estimates of the population size of this group, given the census figures are 1891 (54, 177) the projected estimate of the current size of this population can be put around 2-2.5 lakhs. It is estimated that there are about 40, 000 endogamous units within India. Although a large number of populations were studied for varied sets of genetic markers, they will constitute only a small fraction of the estimated number of Indian populations. The Sishta Karanam is an important and occupationally interesting population, which has not been genetically explored so far. We report here the polymorphism data on the five genetic markers, viz. ABO and Rh (D) blood groups, two serum proteins, Haptoglobin (Hp) and Ceruloplasmin (Cp), and one Red cell enzyme, Glyoxalase (Glo-I) for the first time. Comparative analyses of these data were also done with other caste populations of Andhra Pradesh. Materials and methods
Blood samples were collected from 76 healthy and unrelated male (34) and female (42) members belonging to Sishta Karanam with their informed consent and tested for ABO and Rh (D) blood group systems following standard methods. The sample size varies in the other systems, Haptoglobin (n=50) and Ceruloplasmin (n=50) and Glyoxalase-I (n=50). The serum proteins were analysed by 7% polyacrylamide disc gel electrophoresis (Clarke 1964). Glyoxalase-1 was analysed by starch agarose gel electrophoresis at the Human Genetics Laboratory of the Andhra University, Visakhapatnam.
Results and Discussions
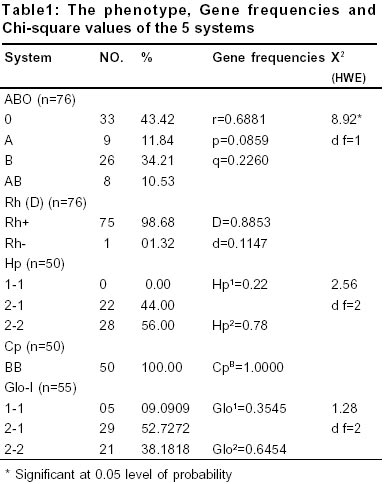
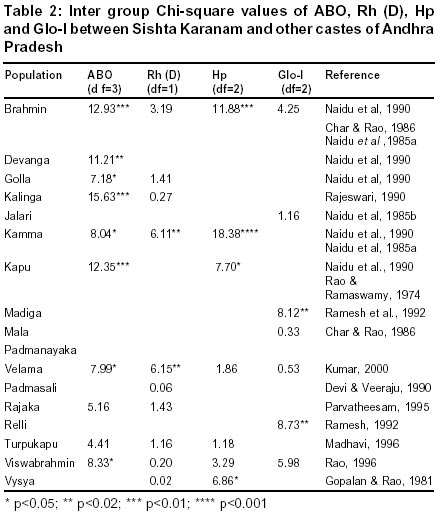
The phenotypic and gene frequencies of the 5 polymorphic loci studied are presented in Table 1. The phenotypes and gene frequencies were compared with the available data on other caste populations studied from Andhra Pradesh and the c2 values for homogeneity are shown in Table 2. ABO and Rh (D) Blood Groups
The present population exhibited the phenotypes O, B, A, and AB and the gene frequencies in the decreasing order of predominance O>B>A>AB respectively. The frequency of the AB phenotype is the highest when compared to the other caste populations of Andhra Pradesh. However, the distribution of the other phenotypes is within the range reported earlier. Nevertheless, probably due to relatively high frequency of AB, this population is not found to be in Hardy-Weinberg equilibrium for this locus. The c2 test (table 2) suggests that Sishta Karanam population is significantly heterogeneous when compared to the other caste populations from this region excepting Rajaka (Parvatheesam, 1995) and Turpu Kapu (Madhavi, 2000). The frequencies of Rh (+) and Rh (-) phenotypes are 98.69% and 1.31%, respectively, which are within the range of distribution reported earlier for the populations of AP. The c2 test revealed significant difference from Kamma (Naidu et al, 1990) and Padmanayaka Velama (Kumar, 2000).
Serum Proteins and Red Cell Enzymes
The study population showed the predominant occurrence of Haptoglobin phenotype 2-2. Surprisingly, although the frequency of the Hp1 allele is found to be quite high (0.22) the Haptoglobin1-1 phenotype could not be traced in this population. The frequency of 2-1 heterozygote is found to be high among them (44%). The Kapu (Rao and Ramaswamy, 1974) and Viswa Brahmin (Rao, 1996) populations of AP also showed absence of 1-1 phenotype but with a relatively lower frequency of HP1 allele. The Hp1gene frequency among the Sishta Karanam is quite comparable to Turpu Kapu (0.2589; Madhavi, 2000) and Padmanayaka Velama (0.2454; Kumar, 2000). The c2 test suggests significant deviation of Hp phenotypic frequency of this population with the Brahmin and Kamma (Naidu et al, 1985a), and Vysya (Gopalam and Rao, 1981). On the other hand, the Ceruloplasmin (Cp) locus was monomorphic in the Sishta Karanam population showing only the BB phenotype. It is interesting to note that all the Andhra caste populations so far screened are monomorphic for this system. The distribution of Glyoxalase-I phenotypes, viz.1-1, 2-1, 2-2, are within the ranges reported earlier among the populations of Andhra Pradesh. However, 2-1 phenotype is the most predominant type found in the study population. As expected, the frequency of the Glo2 allele was greater than the Glo1 allele. This population is observed to be in Hardy-Weinberg equilibrium. The c2 test revealed significant heterogeneity of the gene frequency of this population in comparison to the Madiga (Ramesh et al 1992) and Relli (Ramesh 1992). To summarize, we may say that although this population showed certain interesting features of polymorphism in the markers studied, given the small sample sizes, the conclusions drawn can at best be tentative. Nevertheless, although partially, these data may help fill in the lacuna in the genetic map of India. Acknowledgements
I would like to thank my colleague Komal Madhavi and my friends Aswini Kumar, A. Ramesh and Gayathri for their help throughout my work.
References
Copyright 2002 - the Indian Society of Human Genetics The following images related to this document are available:Photo images[hg02006t2.jpg] [hg02006t1.jpg] |
| |||||||||